








Map layers · 19 layers
Water, layer by layer over the property.
The Water category brings together layers for watercourses, water bodies, wastewater systems, flood hazard and groundwater. The layers are useful when planning work near rivers and streams, for understanding water and wastewater infrastructure in an area, and for assessing flood risk where the more detailed flood zone maps in Risk do not cover the watercourse.
The layers
19 layers in Water
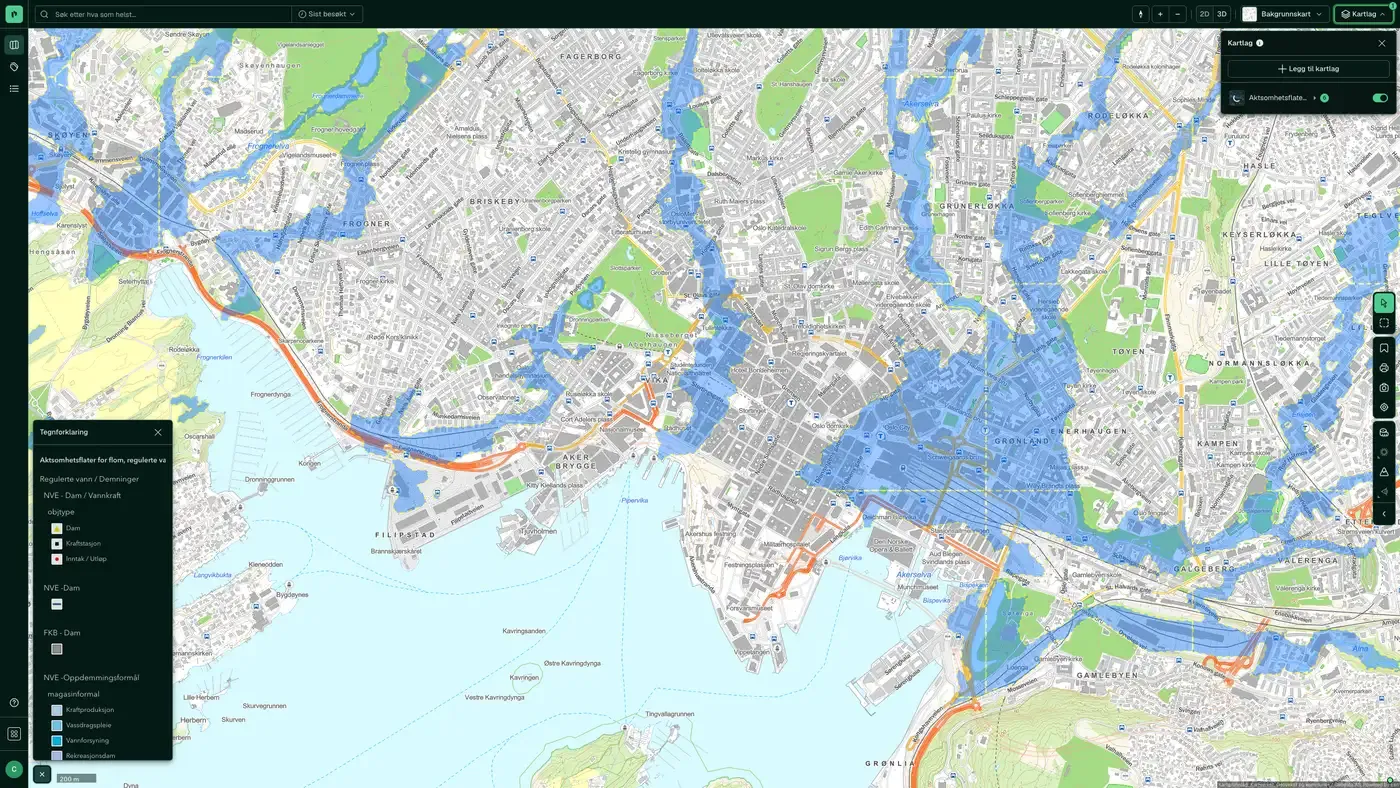
Screenshot: Watercourses and catchments enabled over central Oslo.
| Layer | Description | Source |
|---|---|---|
| Watercourses and catchments | Rivers, streams, lakes and glaciers within a catchment | Norges vassdrags- og energidirektorat (NVE). Datasets: Watercourses and catchments |
| Protected watercourses | Watercourses protected against hydropower development | Norges vassdrags- og energidirektorat (NVE). Datasets: Protected watercourses |
| Water bodies | Surface water and groundwater bodies under the water regulations | Miljødirektoratet |
| Water & sewer assets along roads | Water and sewer manholes and structures along roads | Statens vegvesen |
| Wastewater facilities | Municipal wastewater discharges | Miljødirektoratet |
| Manhole cover, drain and hydrant | Visible water and sewer infrastructure on the ground surface | Norges vassdrags- og energidirektorat |
| High tide / storm surge | Storm surge adjusted for climate to 2050/2100, return periods 20/200/1,000 years | Kartverket |
| Caution surfaces, (regulated) water, dams | National caution map for flooding and dam failure | Norges vassdrags- og energidirektorat (NVE) |
| Flood areas, flood protection areas, and flood events | Detailed flood zones, flood protection and historical events | Norges vassdrags- og energidirektorat (NVE) |
| Groundwater (GRANADA) | National groundwater database with wells and springs | Norges geologiske undersøkelse (NGU) |
| Drainage lines | Drainage lines derived from elevation data at 50 cm resolution | Geodata AS |
| Groundwater boreholes | Drilled groundwater wells and energy wells | Norges geologiske undersøkelse (NGU) |
| Soil moisture | Calculated distance to the nearest point exposed to surface water | Kartverket |
| Nature and cultural areas | Selected cultural landscapes. The dataset shows areas included in the Selected Cultural Landscapes in Agriculture initiative (Utvalgte kulturlandskap i jordbruket). | Miljødirektoratet |
| Land cover type | The main classification in AR5 is land type, based on criteria for vegetation, natural drainage and human influence. | Norsk institutt for bioøkonomi (NIBIO) |
| Depth (sea) | Coastline contour, constructed coastline and skerries are referenced to mean high water. | Kartverket |
| Depth (lake) | NVE's lake database contains hydrological information and the national serial number for lakes and ponds larger than 2,500 m² (2.5 decares), based on N50 map data from Kartverket. | Norges vassdrags- og energidirektorat |
| Aquaculture register | Aquaculture permits and decisions | Fiskeridirektoratet |
| River network | The national river network ELVIS, from main rivers to the full network | Norges vassdrags- og energidirektorat (NVE) |
Layer by layer
What each layer shows
Watercourses and catchments
Shows the connected watercourse system of rivers, streams, lakes and glaciers within a catchment, as surfaces. The river lines themselves are in River network. Data from Norges vassdrags- og energidirektorat (NVE). Useful for understanding the natural drainage direction of water in a planning area, and for identifying whether a property lies close to a watercourse with possible restrictions on works under the Water Resources Act (vannressursloven). Hydrographic division (REGINE) of rivers, lakes and glacier systems into catchments. Includes criteria for river length, lake size and regulation. Updated continuously by NVE.
Protected watercourses
Watercourses protected against hydropower development through the protection plans adopted by the Storting. A protected watercourse cannot be developed with a power plant. Relevant for properties near rivers in mountain or rural areas where hydropower could be an option. Data from Norges vassdrags- og energidirektorat (NVE). Watercourses protected against hydropower development.
Water bodies
Surface water and groundwater bodies classified under the EU water regulations, as implemented in Norwegian law. A surface water body is a delimited and significant volume of surface water. The authorities are responsible for ensuring that these reach good ecological status. Planned works that affect water bodies may require an aquatic environment assessment. Data from Norges vassdrags- og energidirektorat (NVE). Datasets: Water bodies. Shows water bodies for surface water and groundwater. A surface water body is a significant volume of water (catchment area for rivers, and surface area for lakes and coastal water). In addition to hydrographic conditions, its extent is defined by criteria for water type, pressures, ecological status or potential, and chemical status. A groundwater body is defined as a delimited body that either produces 10 m³ per day or can supply 50 people. Water bodies are the basic unit of the water regulations, whose main aim is to ensure integrated water management from mountain to fjord. For surface water, each water body holds the following information: whether it is natural or heavily modified, ecological status or potential, chemical status, environmental objective, and a risk assessment of whether the environmental objective will be met by 2021. For groundwater, it holds the following information: quantitative status, chemical status, environmental objective, and a risk assessment of whether the environmental objective will be met by 2021.
Water & sewer assets along roads
Water and sewer manholes and structures along roads from the national road database (NVDB). Useful for mapping existing water and sewer connection points near a plot, and for assessing whether a new property can be connected to public water and sewage. Selected NVDB objects related to water and sewage (manholes, pipelines, pipe trenches, ditches, toilet facilities). Weekly updates based on the latest NVDB data.
Wastewater facilities
Overview of municipal wastewater facilities and discharge points from the register held by Miljødirektoratet. Useful for identifying wastewater infrastructure in an area and for assessing whether a development affects existing wastewater routes. Overview of discharges of municipal wastewater (KOSTRA reporting). Updated continuously by Miljødirektoratet.
Manhole cover, drain and hydrant
Manholes, drains and fire hydrants registered at the ground surface. Useful for locating water and sewer access points in construction projects, and for planning excavation without hitting pipes. Contains the pipe network that is visible at the ground surface (manhole cover, drain and hydrant), not the complete pipe network. The map layer is based on LedningVA from FKB.
High tide / storm surge
Mean high water and calculated storm surge for return periods of 20, 200 and 1,000 years, adjusted for climate to 2050 and 2100. Data from Kartverket. Relevant for coastal properties and for planning work where sea level rise up to 2100 must be taken into account. Also available in Risk. Datasets: High tide / storm surge. Mean high water and storm surge with 20, 200 and 1,000-year return periods, including climate-adjusted projections for 2050 and 2100.
Caution surfaces, (regulated) water, dams
The national caution map for flooding and dam information from NVE. It covers more ground than the detailed flood zone maps, but with lower precision. It also shows downstream consequence areas for dam failure. Also available in Risk. NVE's caution map for flooding gives an overview of areas that may be exposed to flood hazard, along with regulated water bodies and dams in Norway. The map must not be confused with flood zone maps, which show which areas are actually flooded and with what return period. The caution map is more general and points out areas where flood hazard should be assessed more closely, particularly for new development. It is used as the first basis for assessment in impact assessments and in risk and vulnerability analyses linked to the municipal master plan.
Flood areas, flood protection areas, and flood events
Detailed flood zones, flood protection measures (walls, embankments) and historical flood events from NVE for the best mapped watercourses. Higher precision than the caution surfaces, but covering fewer watercourses. Also available in Risk. This map layer gives a detailed overview of flood-prone areas, flood protection zones and historical flood events in Norway, with particular focus on flood risk assessment. The flood zone map shows which areas are flooded in a flood situation and states the return periods for such events. Selected watercourse stretches with a high damage potential have been mapped to give municipalities a better basis for land use planning and emergency preparedness. NVE has developed guidelines for how flood hazard is to be assessed and integrated into municipal land use plans. The building regulations set safety requirements for different building types. Most buildings must be safe against a 200-year flood. This map layer must not be confused with NVE's caution map for flooding, which gives a more general overview of flood-prone areas, regulated water bodies and dams. The caution map indicates areas where flood hazard should be assessed more closely, particularly for new development. Even if the flood zone map does not show flood hazard in a given area, this may be because the area has not been mapped by NVE. In such cases, we recommend that you also check the caution map.
Groundwater (GRANADA)
The national groundwater database GRANADA from Norges geologiske undersøkelse (NGU). Shows groundwater wells, springs and groundwater bodies. Relevant for rural properties without a connection to municipal water works, and for developers considering ground source heat or a groundwater-based water supply. Datasets: Groundwater (GRANADA). National groundwater database: wells, springs, exploratory drillings, quality, depth to bedrock, borehole parks and monitoring.
Drainage lines
Drainage lines calculated from elevation data (hoydedata.no) at 50 cm resolution. They show terrain-based water paths that are not necessarily mapped streams, but that matter for surface water management. Mapped watercourses with names are in River network. Useful when planning surface water measures and for understanding natural runoff from a plot. Data from Geodata AS. Datasets: Drainage lines. The drainage lines are derived from hoydedata.no at a resolution of 50 cm. The lines cover about 99% of the country and are placed where water collects from an area larger than 1 daa (1,000 m²). Before the analysis, sinkholes in the terrain models were filled. Buildings, culverts and drainage pipes have not been edited. The analyses divided the areas in the same way as NVE's Regine areas, and the attributes from that dataset were then added to the lines.
Groundwater boreholes
A national overview of drilled groundwater wells and energy wells registered in NGU's well database. Relevant for properties where a ground source heat pump is being considered, and for checking whether neighbouring plots already have energy wells that could affect the thermal groundwater balance. The dataset gives a national overview of drilled groundwater wells, energy wells and natural groundwater springs.
Soil moisture
The calculated height difference between a point and the nearest point where surface water collects. It gives an indicative picture of soil moisture and drainage conditions on a plot, which matters when you assess foundation conditions and when you identify possible surface water problems during intense rainfall. Data from Kartverket. Datasets: Soil moisture. The soil moisture map states the height difference in centimetres between a point and the nearest point calculated to be water-saturated.
Aquaculture register
An overview of aquaculture licences and decisions registered with Fiskeridirektoratet. The layer is also available under Coast and fishing. Datasets: Aquaculture register. Licences and decisions for aquaculture sites, including location, species, capacity, biomass, escapes and environmental surveys.
River network
The national river network ELVIS, from main rivers at overview level to the full network when you zoom in. These are mapped watercourses with names and network topology: which river this is, and where it flows on to. Three layers in this category show water, and they answer different questions:
The datasets behind
Datasets in Water
Wastewater facilities
An overview of municipal wastewater facilities and discharge points, based on the Norwegian Environment Agency's specialist system Forurensning (Pollution) and collected through the municipalities' annual KOSTRA reporting.
About the datasetDrainage lines
Modelled water flow lines in the terrain. The lines show where water will collect on an area larger than one decare (1,000 m²). They are based on an analysis of the national terrain model at 50 cm resolution from hoydedata.no.
About the datasetRiver network
ELVIS, the national river network, from main rivers at overview level to the full network when you zoom in.
About the datasetSoil moisture
Modelled soil moisture map. It shows the vertical height difference in centimetres (registered as metres in the layer name) between each terrain point and the nearest point calculated to be water-saturated.
About the datasetWater bodies
Water bodies for both surface water and groundwater.
About the datasetWatercourses and catchments
A watercourse is a connected system of rivers, streams, lakes and glaciers within a catchment area. It runs from its sources in forest and mountains down to a shared outlet in the sea, a lake or a larger river.
About the datasetProtected watercourses
Watercourses protected from hydropower development through Verneplan for vassdrag (the protection plan for watercourses), a legal designation adopted by the Storting over several decades.
About the datasetHow do I turn on the water layers in Fusion?
Click Map layers at the top right of the map, select the category in the list on the left and turn on the layer. You can have several layers on at once, over the same property.
Where do the layers come from?
The sources are listed in the table above, including Norges vassdrags- og energidirektorat (NVE). Datasets: Watercourses and catchments, Norges vassdrags- og energidirektorat (NVE). Datasets: Protected watercourses, Miljødirektoratet, Statens vegvesen. Each layer shows its source and date.
Can I get the same data programmatically?
Yes. The datasets behind the layers are available in the Placepoint API and in Placepoint AI through MCP.
Other categories
The layers and descriptions come from the documentation, synced 16 October 2026.
Used where decisions really matter