








Map layers · 11 layers
Demographics, layer by layer over the property.
The Demographics category shows population composition, income, wealth and education per grunnkrets (basic statistical unit), municipality and county, based on data from Statistisk sentralbyrå (SSB). The layers are useful for market assessments, housing projects, retail location and tenant prospecting where the socio-economic profile matters.
The layers
11 layers in Demographics
The income and wealth figures are based on the annual tax assessment from Skatteetaten (the Norwegian Tax Administration), but SSB aggregates them per grunnkrets before they reach Placepoint. The aggregation level and current statistics year are shown under Income and Wealth.
| Layer | Description | Source |
|---|---|---|
| Wealth | The map shows how average wealth per grunnkrets is distributed across the grunnkretser. | Geodata AS |
| Households | The map shows the number of families and the dominant composition in the grunnkrets. It uses these categories: Single, no children; Single, with children; Multi-family; Couple, with children; and Couple, no children. | Geodata AS |
| Income and wealth statistics | The map shows how average income and wealth are distributed across the grunnkretser, and the number of people in different segments of income, wealth and age. | Geodata AS |
| Voting districts | Shows the voting districts and polling stations available in a municipality. | Geodata AS |
| Income | The map shows how average income per grunnkrets is distributed across the grunnkretser. | Geodata AS |
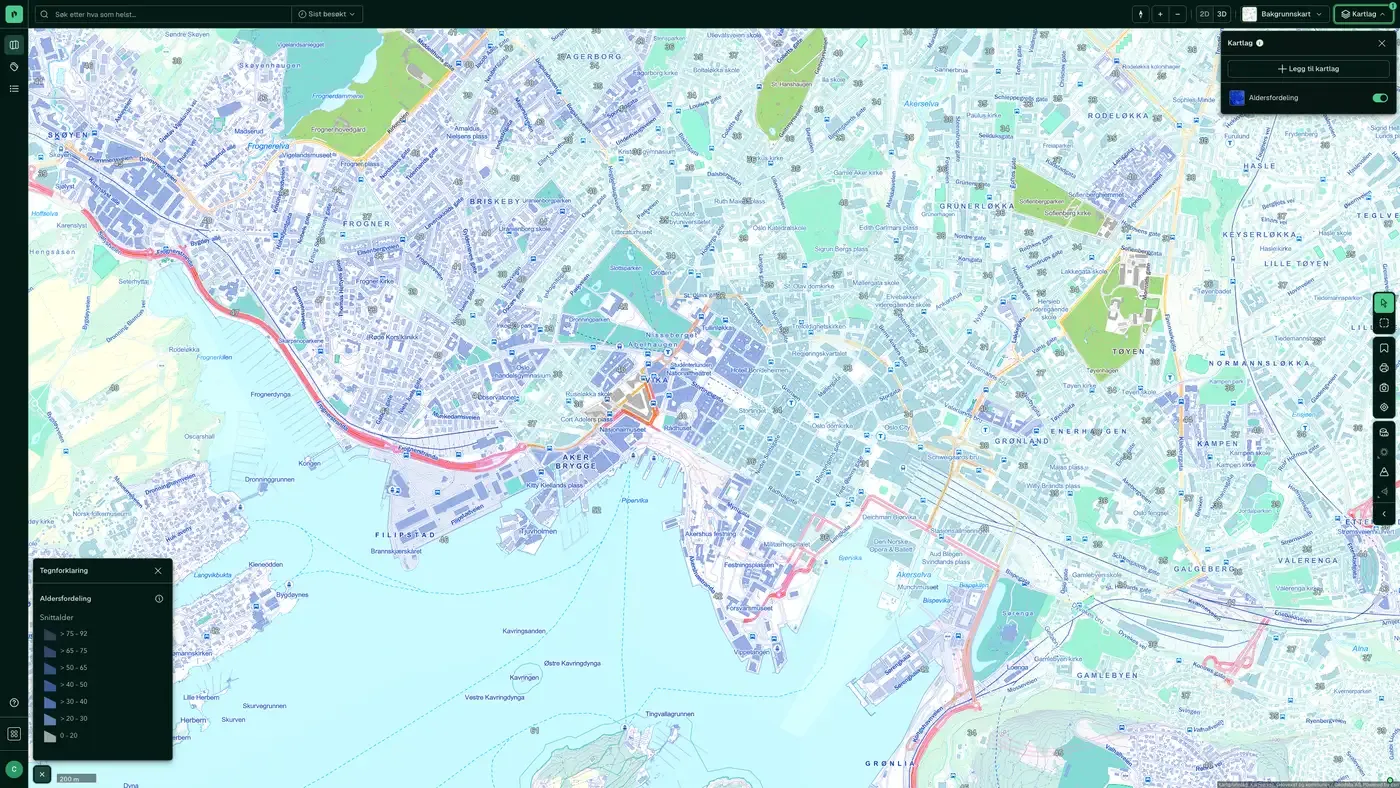
| Age distribution | The map shows average age across all grunnkretser. | Geodata AS |
| Population | Shows population density per grunnkrets, based on registered home address. | Geodata AS |
| Daytime population | The map shows daytime population across all grunnkretser. | Geodata AS |
| Field of education | Shows which field of education most people in a grunnkrets fall under. | Geodata AS |
| Education Level | The education level of people registered as resident in Norway. | Geodata AS |
| Population grid 100 m x 100 m | The map layer shows the number of residents in each cell of a 100 × 100 metre grid | Geodata AS |
Layer by layer
What each layer shows
Wealth
Average wealth distributed across the grunnkretser, kommuner and counties. Data from Statistisk sentralbyrå (SSB). Dataset: Wealth. Average taxable net wealth distributed across grunnkretser.
Households
The number of families and the dominant household composition in the grunnkrets. Data from Statistisk sentralbyrå (SSB). Dataset: Households. The number of families and the dominant household composition per grunnkrets: single without children, single with children, multi-family, couple with children and couple without children.
Income and wealth statistics
Average income and wealth distributed across the grunnkretser, and the number of people. Data from Statistisk sentralbyrå (SSB). Dataset: Income and wealth statistics. The map shows how average income and wealth are distributed across the grunnkretser, and the number of people within different segments of income, wealth and age.
Voting districts
Voting districts and polling stations available in a kommune. Data from Geodata AS. Dataset: Voting districts. Shows voting districts and polling stations in the kommuner. The municipal council or the electoral committee decides the number of voting districts and polling stations. There is normally one polling station per voting district, but the electoral committee can set up extra polling stations where needed. From the 2023 election there is no longer a requirement that the polling station must be physically located inside the voting district.
Income
Average income distributed across the grunnkretser, kommuner and counties. Data from Statistisk sentralbyrå (SSB). Dataset: Income. Average income distributed across grunnkretser.
Age distribution
Average age distributed across all grunnkretser, kommuner and counties. Data from Statistisk sentralbyrå (SSB). Dataset: Age distribution. Average age per grunnkrets.
Population
Population figures distributed across all grunnkretser, kommuner and counties from Statistisk sentralbyrå (SSB). The figures are based on the registered home address, and are a good indicator of "who lives here", typically what you need for housing projects, sizing of schools and kindergartens, and local services. Dataset: Population. Population figures per grunnkrets.
Daytime population
Daytime population distributed across all grunnkretser, kommuner and counties from Statistisk sentralbyrå (SSB). The figures show where people actually are during the day (workplace, school, place of study), based on SSB's links to employment and pupil registers. Dataset: Daytime population. Estimated daytime population per grunnkrets.
Field of education
Which field of education most people in a grunnkrets fall under. Data from Statistisk sentralbyrå (SSB). Dataset: Field of education. Dominant field of education per grunnkrets. Categories: Allmenne fag, Helse- og sosialfag, Humanistiske og estetiske fag, Lærerutdanning, Naturvitenskap, Økonomiske fag, Primærnæringer, Samferdsel, Samfunnsfag and Uoppgitt.
Education Level
The education level of people registered as resident in Norway, from Statistisk sentralbyrå (SSB). Also available under the Education category. Dataset: Education Level. The population's highest completed education, for residents aged 16 and over (plus 15-year-olds who have completed primary school or started upper secondary education).
Population grid 100 m x 100 m
The map layer shows the number of residents in each cell in a grid of 100 x 100 metres. The data is based on demographic statistics from Statistisk sentralbyrå (SSB). The map layer shows the number of residents in each cell in a grid of 100 x 100 metres. The data is based on demographic statistics from Statistisk sentralbyrå (SSB).
The datasets behind
Datasets in demographics
Age distribution
Average age per basic statistical unit in Norway.
About the datasetPopulation
Population per basic statistical unit: the number of registered residents at the latest reference date.
About the datasetDaytime population
The number of people in each basic statistical unit during working hours, typically based on workplaces, schools and commuting.
About the datasetPopulation grid 100 m x 100 m
The map layer shows the number of residents in each cell of a 100 × 100 metre grid.
About the datasetWealth
Average net wealth per basic statistical unit, based on annual tax assessments from Skatteetaten (the Norwegian Tax Administration), compiled and published by Statistisk sentralbyrå (SSB) and distributed to Placepoint by Geodata AS.
About the datasetHouseholds
The number of households and their main composition per basic statistical unit, in five categories: single, no children; single, with children; multi-family; Couple, with children; and Couple, no children.
About the datasetIncome
Average gross income per basic statistical unit, based on annual tax assessments from Skatteetaten (the Norwegian Tax Administration), compiled by Statistisk sentralbyrå (SSB) and distributed to Placepoint by Geodata AS.
About the datasetIncome and wealth statistics
Detailed compiled breakdown of income and wealth per basic statistical unit, with the number of people in different segments by income, wealth and age.
About the datasetVoting districts
Voting districts and polling stations in each municipality.
About the datasetHow do I turn on the demographics layers in Fusion?
Click Map layers at the top right of the map, select the category in the list on the left and turn on the layer. You can have several layers on at once, over the same property.
Where do the layers come from?
The sources are listed in the table above, including Geodata AS. Each layer shows its source and date.
Can I get the same data programmatically?
Yes. The datasets behind the layers are available in the Placepoint API and in Placepoint AI through MCP.
Other categories
The layers and descriptions come from the documentation, synced 16 October 2026.
Used where decisions really matter