








Datasets · Demographics
Voting districts, already linked to every property.
Voting districts and polling stations in each municipality. The municipal council or electoral board decides the number of voting districts and polling stations. There is usually one polling station per voting district, but the municipality can add more if needed.
What the dataset contains
Voting districts in Placepoint
Voting districts and polling stations in each municipality. The municipal council or electoral board decides the number of voting districts and polling stations. There is usually one polling station per voting district, but the municipality can add more if needed. Since the 2023 election, the polling station no longer has to be inside the voting district: the municipality can use a suitable venue outside it. Geodata AS supplies this dataset to Placepoint.
Voting districts also serve as a geographical division for electoral research and demographic analysis, at a scale between the basic statistical unit and the municipality. For property analysis, the dataset is mainly a geographical reference division and rarely a first-order signal of market conditions. It works well alongside Municipality Borders, School catchment areas and Population. Part of Placepoint's Demographics map layers.
This text is based on the dataset documentation, synced 16 October 2026.
What it looks like
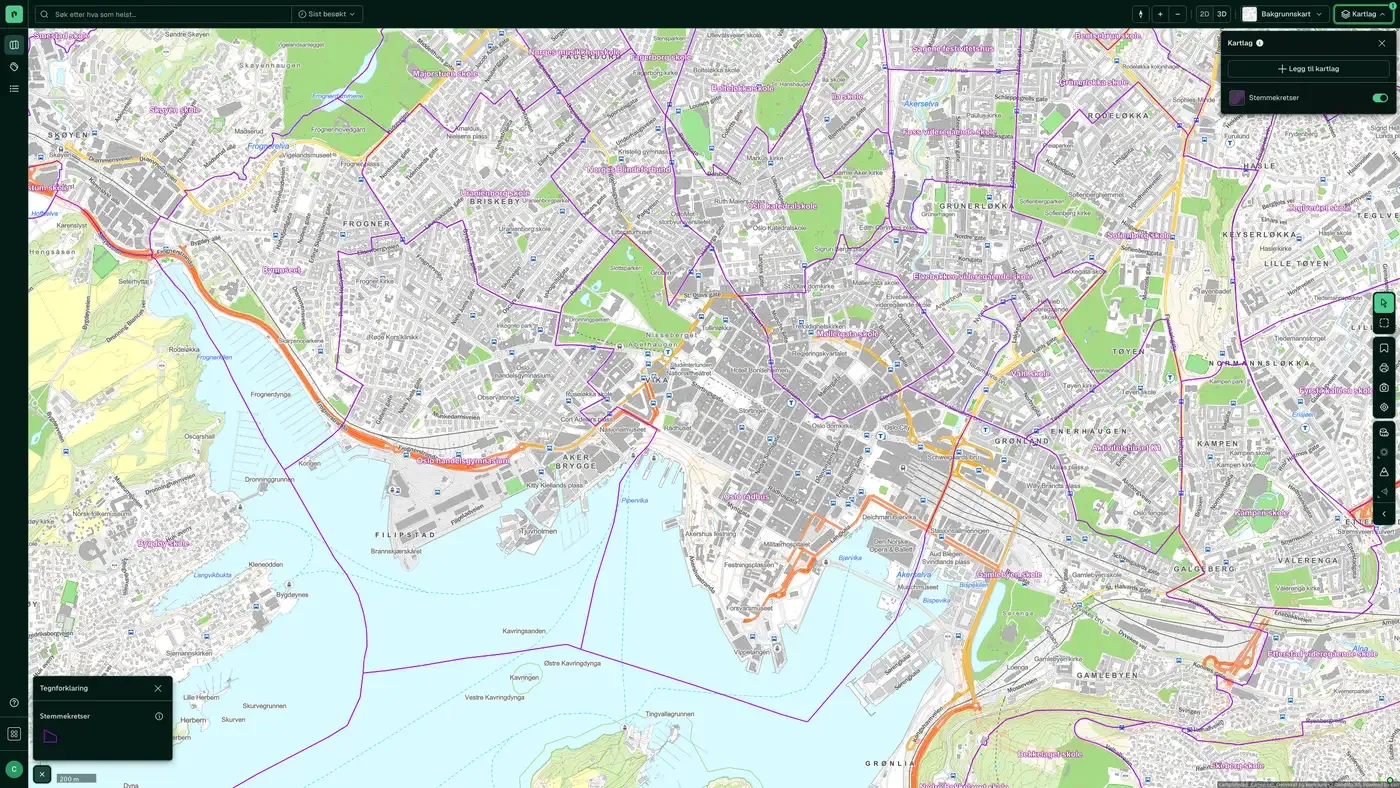
Voting districts on the map
The dataset is part of the Demographics map layer:
Source: Statistisk sentralbyrå (SSB). Last updated 9 September 2026
More in the Demographics map layer
Datasets often read together
Age distribution
Average age per basic statistical unit in Norway.
About the datasetPopulation
Population per basic statistical unit: the number of registered residents at the latest reference date.
About the datasetDaytime population
The number of people in each basic statistical unit during working hours, typically based on workplaces, schools and commuting.
About the datasetPopulation grid 100 m x 100 m
The map layer shows the number of residents in each cell of a 100 × 100 metre grid.
About the datasetWealth
Average net wealth per basic statistical unit, based on annual tax assessments from Skatteetaten (the Norwegian Tax Administration), compiled and published by Statistisk sentralbyrå (SSB) and distributed to Placepoint by Geodata AS.
About the datasetHouseholds
The number of households and their main composition per basic statistical unit, in five categories: single, no children; single, with children; multi-family; Couple, with children; and Couple, no children.
About the datasetHow often are voting districts updated?
Weekly. The frequency follows the source and is shown on the dataset in Placepoint.
Where does the data come from?
From Geodata AS. We collect and quality-check the data and place it on the correct property, with source and date on every field.
How do I see voting districts on a property?
Look up the address in Fusion and turn on the Demographics map layer. The dataset is a separate layer there, and the details appear in the property panel when you click on the map.
Can I get the dataset programmatically?
Yes. The same data is available in Placepoint API and in Placepoint AI through MCP, so you can bring it into your own systems and agents.
Used where decisions really matter