








Map layers · 18 layers
Risk, layer by layer over the property.
The Risk category brings together natural hazard and environmental risk layers for purchase assessments, due diligence and planning processes. The layers show susceptibility zones for landslides, floods, quick clay and storm surge, as well as radon risk and contaminated land.
The layers
18 layers in Risk
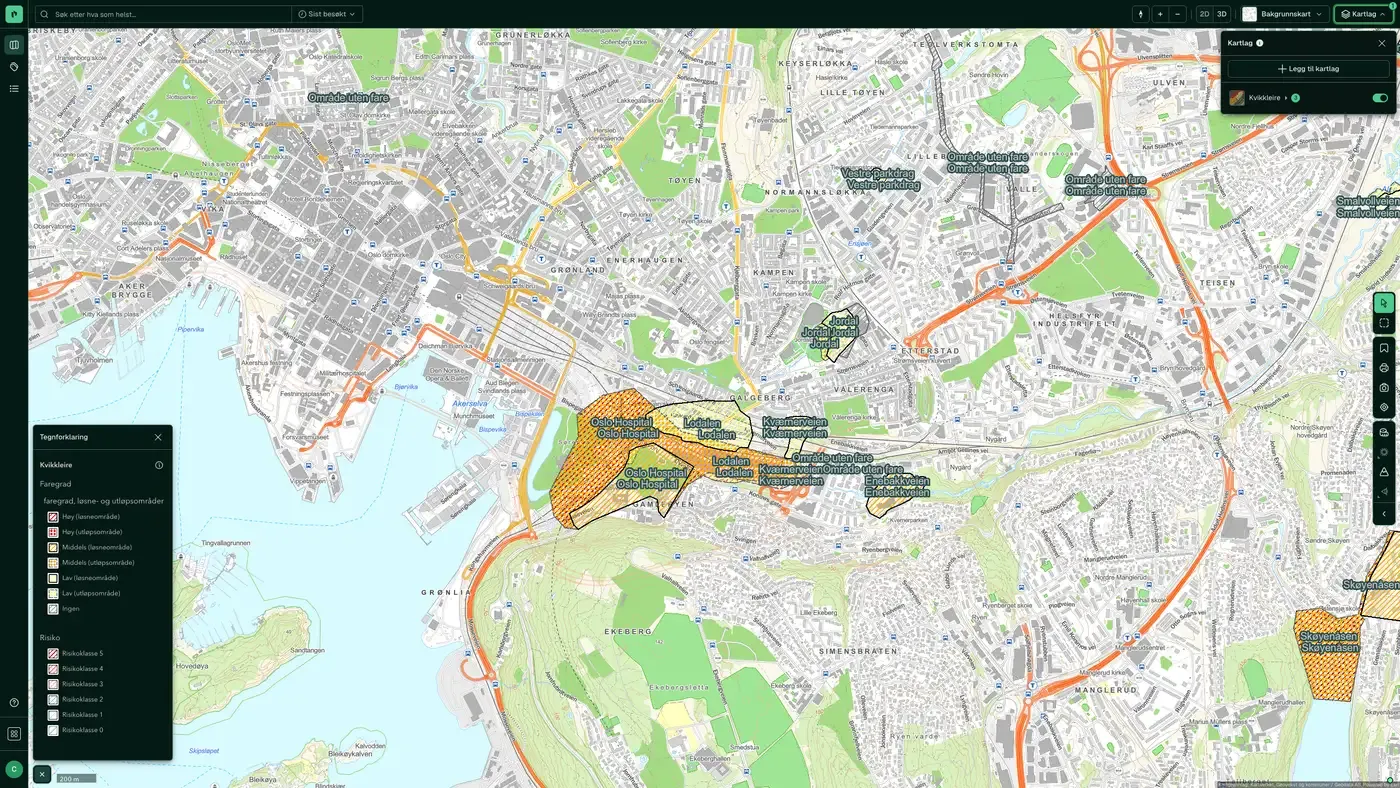
Screenshot: Landslides enabled over central Oslo.
| Layer | Description | Source |
|---|---|---|
| Fire Stations Response Time | Fire stations with driving distance within 5, 10 and 20 minutes | Placepoint |
| Cultural heritage - Askeladden WMS | All cultural heritage data from Askeladden (national cultural heritage database) | Riksantikvaren |
| Traffic accidents – temperature | Accident location, weather conditions and extent of injury for personal injury accidents | Statens vegvesen. Datasets: Traffic accidents |
| Traffic accidents – heat map | Heat map of accident-prone locations | Statens vegvesen |
| Quick clay | Zones with potential danger of quick clay landslides | Norges vassdrags- og energidirektorat |
| Quick Clay – Caution | Susceptibility zones for quick clay based on marine clay deposits and terrain criteria | Norges vassdrags- og energidirektorat (NVE) |
| Landslides | Susceptibility map for rockfall, snow avalanches and debris slides | Norges vassdrags- og energidirektorat (NVE) |
| Radon susceptibility | Zones with probable elevated radon risk | Norges geologiske undersøkelse (NGU). Datasets: Radon susceptibility |
| Possibility of marine clay | Combined analysis of superficial deposits and marine border | Norges geologiske undersøkelse (NGU). Datasets: Possibility of marine clay |
| Loose masses | Distribution of superficial deposit types | Norges geologiske undersøkelse (NGU) |
| Contaminated land | Properties with contaminated land and landfills | Miljødirektoratet |
| High tide / storm surge | Storm surge adjusted for climate to 2050 and 2100, return period 20/200/1,000 years | Kartverket. Datasets: High tide / storm surge |
| Flood areas, flood protection areas, and flood events | Flood-prone zones, flood protection and historical events | Norges vassdrags- og energidirektorat (NVE). Datasets: Flood areas, flood protection areas, and flood events |
| Caution surfaces, (regulated) water, dams | Susceptibility map for floods and dam information | Norges vassdrags- og energidirektorat (NVE) |
| Protection structures | Structures built against floods, erosion and landslides, with type of measure and built year | Norges vassdrags- og energidirektorat (NVE) |
| Snow avalanches, Armed Forces hazard map | Release and runout areas from the Norwegian Armed Forces' own mapping | Norges vassdrags- og energidirektorat (NVE) |
| Flood hazard map | The Flood hazard map shows areas flooded at different flood sizes (return period) | Norges vassdrags- og energidirektorat (NVE) |
| Industrial emissions | Land-based industrial facilities with a discharge permit, with industry, operating status and whether the facility discharges to air or water | Miljødirektoratet |
Layer by layer
What each layer shows
Cultural heritage - Askeladden WMS
All cultural heritage data from Askeladden, Riksantikvaren's national cultural heritage database. Shows automatically protected cultural heritage (from the Middle Ages and earlier), heritage sites protected by decision and SEFRAK -registered buildings. A cultural heritage site within a plan area can give grounds for objection and require archaeological investigation under the Cultural Heritage Act. The layer is also available under Property. The display service contains data on archaeological cultural heritage, cultural environments, buildings and technical installations that are protected under the Cultural Heritage Act or the Planning and Building Act. The service also contains cultural heritage sites and cultural environments without formal protection, but registered as locally valuable, as well as world heritage areas and environments.
Traffic accidents – temperature
Event-based map from Statens vegvesen with information about personal injury accidents: accident location, weather conditions at the time of the accident and extent of injury. Useful for mapping traffic hazard points near a plan area or for assessing safety for pedestrians and cyclists. Information about the accident location, weather conditions and the extent of injuries, mainly for accidents involving personal injury.
Traffic accidents – heat map
Aggregated heat map of locations with many registered traffic accidents. Gives a quick picture of accident concentrations without having to read individual points. Combine it with Traffic accidents – temperature to see cause data. A heat map that highlights places with frequent accidents. It includes information about the accident location, weather conditions and the extent of injuries. It mainly covers accidents involving personal injury.
Quick clay
Zones with potential hazard of larger quick clay landslides, from NVE / NGI. Quick clay is marine clay that under certain conditions can lose its bearing capacity and trigger large slides. The layer marks caution zones, not documented hazard zones. Development within the zones requires a geotechnical investigation. See also Possibility of marine clay for a more detailed analysis of clay type. A quick clay caution zone means that a geotechnical investigation is required, not that a landslide is likely.
Landslides
Caution map for rockfall, snow avalanches and earth slides from Norges vassdrags- og energidirektorat (NVE). Each landslide type is shown in separate layers with a different colour tone. The caution map indicates terrain where landslides have occurred historically, or where topography and geology suggest that landslides can happen. It is not a statistical probability calculation per property. Dataset: Skred. Caution maps (rockfall, snow avalanche, quick clay, possibility of marine clay, earth flow), registered landslide events and rock avalanche hazard zones with return periods. Sources: NVE, NGI, NGU.
Radon susceptibility
Shows areas in Norway that are probably more radon prone than average, based on bedrock geology from Norges geologiske undersøkelse (NGU). Radon is a naturally occurring radioactive gas that can accumulate in buildings and pose a health risk. New homes have radon protection requirements under TEK17 § 13-5. The caution map gives an indicative picture; the actual radon concentration is measured with a radon meter inside the building. The national radon caution map shows which areas in Norway are probably more radon prone than others. In areas marked as high caution, at least 20% of homes are estimated to have radon concentrations above the recommended limit of 200 Bq/m³ on the ground floor. The dataset is based on indoor air measurements of radon (from the NRPA database) and knowledge of geological conditions (NGU's databases for bedrock and loose masses). In some areas radon has been measured in many homes, while in others few measurements are available. The dataset was developed by assessing statistically how the share of homes with high radon concentrations can be linked to local geology, and by applying this knowledge to other areas with similar geological conditions. Use The national radon caution map gives municipalities a basis for an initial assessment of radon hazard. In areas of high or very high caution, the municipality should check whether radon needs to be followed up under the Planning and Building Act and the Public Health Act and their regulations. The map cannot be used to predict the radon concentration in individual buildings. The only way to know the radon level in a building for certain is to measure it.
Possibility of marine clay
Calculated from loose mass maps and the marine limit dataset from Norges geologiske undersøkelse (NGU). Marine clay was deposited below sea level after the last ice age and can, under certain conditions, contain quick clay. The layer supplements the Quick clay layer with a more detailed analysis of which sediment types are found below the terrain. The "Mulighet for marin leire" (MML) dataset is based on loose mass maps and the marine limit (MG) dataset, and shows where marine clay may potentially be found, either at the surface or beneath other loose mass types.
Loose masses
Distribution of the loose mass types that cover the rock surface, from Norges geologiske undersøkelse (NGU). The loose mass maps classify sediments such as moraine, river deposits, marine and fjord deposits and rock outcrops. Relevant for geotechnical assessment and for understanding drainage conditions on a site. Also available in the Geology category. Dataset: Løsmasser. The loose mass data mainly shows the distribution of the loose mass types that cover the rock surface. Most of the loose masses were formed during and after the last ice age. The data only shows which soil type dominates in the top few metres of the terrain surface.
Contaminated land
Properties registered with contaminated land and municipal or private landfills in the Miljødirektoratet database. See Pollution for the full description and an important caveat about how complete the register is. Properties with contaminated land and municipal, private and industrial landfills, based on mapping and reporting.
High tide / storm surge
Shows mean high water and calculated storm surge for return periods of 20, 200 and 1,000 years, climate-adjusted to 2050 and 2100. Data from Kartverket. Relevant for coastal properties and for planning work where sea level rise up to 2100 must be taken into account under national planning guidelines. Mean high water and storm surge with 20, 200 and 1,000-year return periods, including climate-adjusted projections for 2050 and 2100.
Flood areas, flood protection areas, and flood events
Shows flood-prone areas (NVE's flood zone maps), flood protection measures (walls, embankments, pumping stations) and historical flood events. Norges vassdrags- og energidirektorat (NVE) has mapped the flood zones along the most exposed watercourses; coverage is not nationwide. For watercourses without flood zone maps, use the caution surfaces layer as a supplement. This map layer gives a detailed overview of flood-prone areas, flood protection zones and historical flood events in Norway, with particular focus on flood risk assessment. The flood zone map shows which areas are flooded in a flood situation and states the return periods for such events. Selected watercourse stretches with a high damage potential have been mapped to give municipalities a better basis for land use planning and emergency preparedness. NVE has developed guidelines for how flood hazard is to be assessed and integrated into municipal land use plans. The building regulations set safety requirements for different building types. Most buildings must be safe against a 200-year flood. This map layer must not be confused with NVE's caution map for flooding, which gives a more general overview of flood-prone areas, regulated water bodies and dams. The caution map indicates areas where flood hazard should be assessed more closely, particularly for new development. Even if the flood zone map does not show flood hazard in a given area, this may be because the area has not been mapped by NVE. In such cases, we recommend that you also check the caution map.
Caution surfaces, (regulated) water, dams
NVE's nationwide flood caution map, with information about regulated reservoirs and downstream dam break zones. Useful for watercourses that are not covered by detailed flood zone maps. It also shows which dams can affect an area in a break scenario. NVE's caution map for flooding gives an overview of areas that may be exposed to flood hazard, along with regulated water bodies and dams in Norway. The map must not be confused with flood zone maps, which show which areas are actually flooded and with what return period. The caution map is more general and points out areas where flood hazard should be assessed more closely, particularly for new development. It is used as the first basis for assessment in impact assessments and in risk and vulnerability analyses linked to the municipal master plan.
Fire Stations Response Time
Placepoint's own derived analysis: all fire stations in Norway with calculated driving distance for a callout within 5, 10 and 20 minutes. Source: Brannstasjoner responstid. Used to assess risk for housing projects, commercial property and municipal emergency preparedness, and is related to Public Shelters in Buildings. The map layer gives a detailed overview of all fire stations in Norway, with associated driving distances for callout times of 5, 10 and 20 minutes. Useful for emergency services, local authorities and municipalities when assessing fire protection coverage and emergency preparedness planning.
Quick Clay – Caution
Caution zones for quick clay landslides based on marine clay deposits combined with terrain criteria (height difference and slope). Data from Norges vassdrags- og energidirektorat (NVE). It supplements the main Quick clay layer with a more detailed analysis of where the terrain gives grounds to expect quick clay hazard. The layer is also available under Geology. Shows areas that may be exposed to quick clay landslides, based on marine clay deposits and terrain criteria (slope and height difference). If the measure lies within the caution area, the procedure in NVE guideline 1/2019 must be followed and geotechnical expertise obtained. The map replaces the earlier "Aktsomhet marin leire" and now also captures terrain that can trigger landslides. The map is updated regularly and should be seen together with the hazard zone map for a full assessment.
Protection structures
Structures built to protect against floods, erosion and landslides, with measure type, year of construction and owner. The point layer is shown at overview level, and the lines and polygons when you zoom in. A protection structure tells you that the hazard is known and handled, which a caution map alone does not show. Source: Norges vassdrags- og energidirektorat (NVE). Structures built to protect against floods, erosion and landslides, with measure type, year of construction and who owns the structure. The point layer is shown at overview level, and the lines and polygons when you zoom in. Source: NVE.
Snow avalanches, Armed Forces hazard map
Release and runout areas for snow avalanches from the Armed Forces' own mapping, with separate layers for what has been mapped and what has not. The dataset covers the Armed Forces' areas, not the whole country, so missing coverage does not mean the hazard is ruled out. Source: Norges vassdrags- og energidirektorat (NVE). Release and runout areas for snow avalanches from the Armed Forces' own mapping, with separate layers for what has been mapped and what has not. The dataset covers the Armed Forces' areas, not the whole country. Source: NVE.
Flood hazard map
Flood zones show areas that are flooded at different flood magnitudes (return period). Flood zones are produced for the 20, 200 and 1,000 year floods. Flood zones show areas that are flooded at different flood magnitudes (return period). Flood zones are produced for the 20, 200 and 1,000 year floods. In areas where climate change is expected to increase water flow by more than 20%, a flood zone is produced for the 200-year flood in the year 2100. Application In land use planning, you can use flood zones to identify areas that should not be developed, and to assess relevant risk-reducing measures if development cannot be avoided. Guideline 2-2011 Flaum- og skredfare i arealplanar describes how the safety requirements for structures in the building regulations (TEK 17) section 7-2 can be met in land use planning. In detailed planning and when processing subdivision and building applications, you must take into account that the flood zones have limited accuracy. Start from the calculated water levels and check the terrain height on site. If development is planned in flood-prone areas, we recommend adding a safety margin to the calculated water levels to allow for uncertainty in the data and calculations.
Industrial emissions
Land-based industrial plants with an emission permit, with industry, operating status and whether the plant emits to air or water. Active plants are shown in yellow, closed plants in grey. Land-based industrial plants with an emission permit, with industry, operating status and whether the plant emits to air or water. Active plants are shown in yellow, closed plants in grey. Source: Miljødirektoratet (Norske utslipp).
The datasets behind
Datasets in Risk
Caution surfaces, (regulated) water, dams
NVE's flood awareness map: a coarser first assessment of where flood hazard should be investigated further.
About the datasetFire Stations Response Time
Placepoint's derived analysis of all fire stations in Norway with their driving response time zones: 5, 10 and 20 minutes, calculated from each station.
About the datasetFlood hazard map
The Flood hazard map shows areas that flood at different flood sizes (return periods).
About the datasetHigh tide / storm surge
Modelled storm surge and sea level rise zones for Norway's coast, supplied to Placepoint by Geodata AS.
About the datasetQuick clay
Quick clay is a particular type of marine clay that loses all its bearing capacity when disturbed or loaded. It is the single factor in Norwegian geotechnics that most often stops development projects or makes them more expensive.
About the datasetQuick Clay – Caution
Shows areas that may be exposed to quick clay landslides, based on marine clay deposits and terrain criteria (slope and height difference).
About the datasetRadon susceptibility
Areas in Norway that are likely to be more exposed to radon than others, based on the Norwegian Radiation Protection Authority's (NRPA) national database of indoor air measurements and NGU's bedrock and superficial deposit databases.
About the datasetProtection structures
Structures built to protect against flooding, erosion and landslides, with type of measure, year built and who owns the structure.
About the datasetLandslides
Landslide hazard data compiled from several underlying sources, distributed to Placepoint by Geodata AS.
About the datasetHow do I turn on the Risk layers in Fusion?
Click Map layers at the top right of the map, select the category in the list on the left and turn on the layer. You can have several layers on at once, over the same property.
Where do the layers come from?
The sources are listed in the table above, including Placepoint, Riksantikvaren and Statens vegvesen. Datasets: Traffic accidents, Statens vegvesen. Each layer shows its source and date.
Can I get the same data programmatically?
Yes. The datasets behind the layers are available in the Placepoint API and in Placepoint AI through MCP.
Other categories
The layers and descriptions come from the documentation, synced 16 October 2026.
Used where decisions really matter