








Map layers · 31 layers
Geology, layer by layer over the property.
The Geology category brings together bedrock and superficial deposit maps, the marine border, mineral deposits and groundwater data from NGU (Norges geologiske undersøkelse). The layers give the geological background for geotechnical assessments, risk analysis (quick clay, radon, marine clay) and resource mapping.
The layers
31 layers in Geology
| Layer | Description | Source |
|---|---|---|
| Bedrock N250 | The map data in Bedrock N250 is mainly based on the nationwide, printed bedrock geology map series at a scale of 1:250,000. | Norges geologiske undersøkelse |
| Bedrock N50 | The maps are built on a combined interpretation of field observations, geophysical data, digital elevation models and aerial photos, along with analyses of collected samples. | Norges geologiske undersøkelse |
| Marine border | The marine border shows the highest level the sea reached after the last ice age. | Geodata AS |
| Mining rights | The data shows areas covered by mining rights for state minerals, as defined by the "Lov om erverv og utvinning av mineralressurser (mineralloven)" (the Minerals Act). | Geodata AS |
| Gravel and crushed stone | The Grus- og Pukkdatabasen (sand, gravel and crushed rock database) at NGU contains information on almost all sand, gravel and crushed rock deposits and extraction sites in Norway for use as raw material for building and construction. | Geodata AS |
| Mineral resources | The data gives an overview of registered entries for industrial minerals, natural stone and metal resources. The mineral resource data contains both area and point entries for all three groups. | Geodata AS |
| Petroleum Cultural | This map layer gives a detailed view of petroleum geology in Norway and covers critical elements such as faults, geological boundaries, published lead contours, domes, structural... | Geodata AS |
| Petroleum Wellbores | This map layer gives a full overview of petroleum wellbores located in Norway's offshore and onshore regions. | Geodata AS |
| Geological heritage | Geological localities of particular value give insight into geological heritage and diversity, useful in planning and risk assessment. | Norges geologiske undersøkelse |
| NADAG – ground investigations | The national database for ground investigations (NADAG) contains data from completed geotechnical investigations (geotechnical drilling). | Norges geologiske undersøkelse |
| Petroleum Infrastructure | This map layer gives a detailed view of petroleum infrastructure in Norway and covers key facilities and pipelines that are essential to the oil and gas industry. | Geodata AS |
| Quick clay - Hazard awareness | Shows areas where there may be a risk of quick clay landslides, based on marine clay deposits and terrain criteria (height difference and slope). | Norges vassdrags- og energidirektorat |
| Quick clay | The maps give an overview of zones with potential hazard (hazard awareness areas) for large quick clay landslides. | Norges vassdrags- og energidirektorat |
| Landslides | NVE rockfall hazard awareness map. Potential release and runout areas for rockfall. | Geodata AS |
| Radon susceptibility | The dataset shows which areas in Norway are likely to be more exposed to radon than others. | Geodata AS |
| Possibility of marine clay | The dataset 'Possibility of marine clay' (MML) is based on loose mass maps and the marine border (MG) dataset. It shows where marine clay may be found, either at the surface or beneath other... | Geodata AS |
| Loose masses | The loose masses data mainly shows the extent of the types of loose masses that cover the bedrock surface. | Geodata AS |
| Groundwater (GRANADA) | The national groundwater database (GRANADA) provides information on wells and springs in loose masses and bedrock, probe drillings, groundwater quality, depth to bedrock, well fields, and monitoring of... | Norges geologiske undersøkelse |
| Drainage lines | Drainage lines are derived from http://hoydedata.no at a resolution of 50 cm. | Geodata AS |
| Groundwater boreholes | The dataset gives a national overview of drilled groundwater wells, energy wells and natural groundwater springs. | Geodata AS. Datasets: Groundwater boreholes |
| Soil moisture | The soil moisture map states the height difference in centimetres between a point and the nearest point calculated to be water-saturated. | Geodata AS. Datasets: Soil moisture |
| Quick Clay – Caution | Susceptibility zones for quick clay landslides based on marine clay deposits and terrain criteria (height difference and slope) | Norges vassdrags- og energidirektorat (NVE) |
| Bedrock | Modernised map service showing a continuous 1:250,000 bedrock map that covers all of Norway, with harmonised interpretation across map sheets | Norges geologiske undersøkelse (NGU) |
| Geology | | Geodata AS | |
| Geology (combined) | Includes: mining rights, groundwater boreholes, gravel and crushed stone, loose masses, marine border, mineral resources, possibility of marine clay and radon susceptibility | Placepoint |
| Bedrock, derived maps, NiN | Derived bedrock maps from NGU for Natur i Norge: a forecast of lime content in the bedrock and the extent of ultramafic rocks | Norges geologiske undersøkelse (NGU) |
| Drill cores | NGU's drill core archive: places where drill cores have been taken for bedrock, natural stone, metals and industrial minerals | Norges geologiske undersøkelse (NGU) |
| Geochemistry | NGU's national geochemistry database: field samples of loose masses, stream sediments and water with analysed elements, and measurement points with geochemical measurements | Norges geologiske undersøkelse (NGU). Datasets: Loose masses |
| Geosites, GNIST | NGU's register of geosites: localities with geological value for teaching, research, outdoor life and geotourism, shown as polygons and symbols at national, regional and local level depending on how far you have zoomed in | Norges geologiske undersøkelse (NGU) |
| Landforms, NiN | NGU's landform map based on Natur i Norge: clay ravines, clay landslide pits, kettle holes, fossil deltas and earth pyramids as polygons, symbols and lines, with a geotope value from insignificant to very high | Norges geologiske undersøkelse (NGU) |
| Permafrost | NGU's permafrost mapping: study areas with mapped permafrost and boreholes with temperature measurements in Norway and on Svalbard | Norges geologiske undersøkelse (NGU) |
Layer by layer
What each layer shows
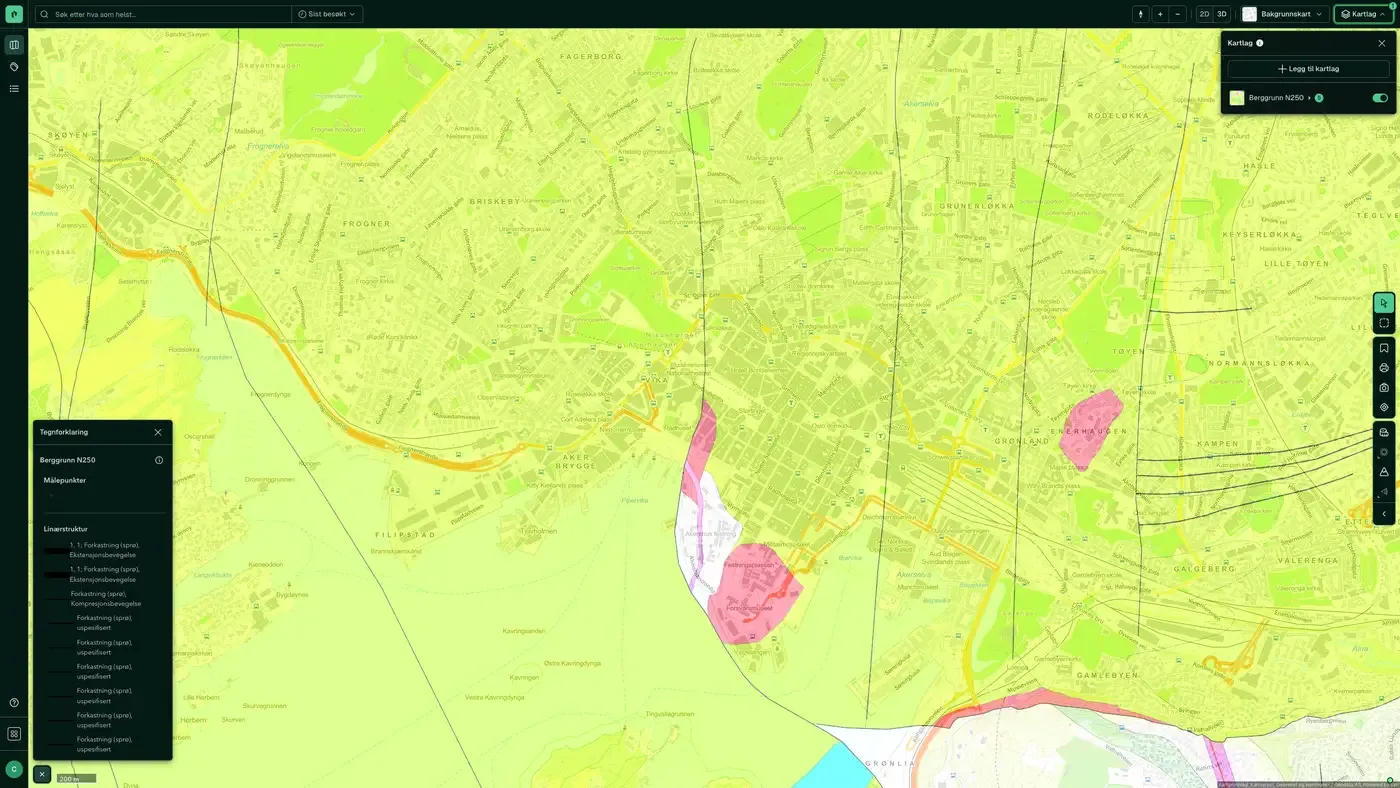
Bedrock N250
National bedrock geology map data at a scale of 1:250,000. Data from Norges geologiske undersøkelse (NGU). The layer includes sublayers for polygons, boundaries, lines, linear structure and survey points, which can be hidden or shown individually with the Hide/Show control in Active Layers. Datasets: Bedrock. The map data is mainly based on the national printed bedrock geology map series at a scale of 1:250,000, and has since been harmonised across map sheet boundaries and updated with newer map data.
Bedrock N50
Combined interpretation of field observations, geophysical data and digital elevation models at a scale of 1:50,000. Data from Norges geologiske undersøkelse (NGU). More detailed than N250, but does not cover the whole country with the same precision. The layer includes the same subtypes as N250 (polygons, boundaries, lines, linear structure, survey points). The maps are built on a combined interpretation of field observations, geophysical data, digital elevation models and aerial photos, along with analyses of collected samples.
Marine border
The highest level the sea reached after the last ice age. Data from Geodata AS. The marine border is an important reference point when assessing quick clay landslides: loose masses deposited below the marine border may contain sensitive marine clay. Combine it with Loose masses and Possibility of marine clay for a combined geotechnical background check. Datasets: Marine border. The marine border marks the highest level the sea reached after the last ice age. The information is central to the work of delimiting areas with marine clays in Norway. Issues linked to such deposits can be ruled out above the marine border, which is important in public planning work. Quick clay and landslides in marine deposits can only occur below the marine border.
Mining rights
Areas covered by mining rights for state-owned minerals, under the mineral act (mineralloven). Data from Norges geologiske undersøkelse (NGU). Important for development in mining regions: active mining rights can limit land use. Datasets: Mining rights. The data shows areas covered by mining rights for state-owned minerals under mineralloven. The dataset contains defined areas for exploration rights (UN) and extraction rights (UT). Several mining rights may be issued for the same geographic area; the individual rights have different priority based on the date received. Direktoratet for mineralforvaltning med Bergmesteren for Svalbard (DMF) owns the dataset. Exploration rights are valid for 7 years, extraction rights for 10 years.
Gravel and crushed stone
The gravel and crushed stone database with information on deposits and extraction sites used as raw material for building and construction work. Data from Norges geologiske undersøkelse (NGU). The layer covers point, line and polygon registrations. Useful when assessing mass transport and mass extraction in planning processes. Datasets: Gravel and crushed stone. NGU's gravel and crushed stone database holds information on most gravel and crushed stone deposits and extraction sites in Norway for use as raw material in building and construction work, with information on land use, volume, quality and the importance of the resources.
Mineral resources
Registered entries for industrial minerals, natural stone and metal resources, with both area and point entries. Data from Norges geologiske undersøkelse (NGU). Datasets: Mineral resources. Overview of registered deposits of industrial minerals, natural stone and metal resources, with both area and point entries for all three groups.
Petroleum Cultural
Detailed presentation of petroleum geology in Norway, including faults, geological boundaries, play outlines, domes and structural elements. Data from Sokkeldirektoratet (formerly Oljedirektoratet). Mainly relevant for offshore and coastal areas. Datasets: Petroleum Cultural. The map layer gives a detailed presentation of petroleum geology in Norway, with elements such as faults, geological boundaries, published play outlines, domes, structural elements and oil and gas geochemistry.
Petroleum Wellbores
Overview of petroleum well drilling in Norway's offshore areas, separating exploration wells, development wells and other wellbores. Data from Sokkeldirektoratet (formerly Oljedirektoratet). Datasets: Petroleum Wellbores. The map layer gives an overview of petroleum wellbores in Norway's offshore and onshore regions, categorised by type, including active well and development well.
Geological heritage
Geological localities of particular value, registered by NGU. Data from Norges geologiske undersøkelse (NGU). The layer covers both polygon and point registrations. It can be relevant in planning processes where cultural environment and natural values are mapped. Datasets: Geological heritage. Geological localities of particular value give insight into geological heritage and diversity, useful in planning and risk assessment. The map layer from NGU contains both large landscape features and smaller geosites, and can be used in impact assessments and sustainable land management. Supplementary fact sheets give detailed descriptions of each geosite.
NADAG – ground investigations
The national database for ground investigations (NADAG) shows the location of geotechnical boreholes, sampling and stability analyses carried out by municipalities, Statens vegvesen and private parties. Data from Norges geologiske undersøkelse (NGU). Useful for seeing whether existing geotechnical data exists on or near a plot, which can reduce the cost of a new ground investigation. Also available under Infrastructure. Datasets: NADAG – ground investigations. The national database for geotechnical investigations (boreholes), operated by NGU in cooperation with partners. The amount of information per data point varies depending on the supplier.
Petroleum Infrastructure
Detailed representation of petroleum infrastructure in Norway, including pipelines, subsurface and surface facilities, and onshore plants. Data from Sokkeldirektoratet (formerly Oljedirektoratet). Also available under Infrastructure. Datasets: Petroleum Infrastructure. The map layer gives a detailed representation of petroleum infrastructure in Norway, with key facilities and pipelines that are essential to the oil and gas industry.
Quick clay
Zones with potential danger of quick clay landslides, classified by risk and hazard level. Data from NVE / NGI. The layer distinguishes between mapped areas, risk classes and hazard level. Also available under Risk. The maps give an overview of zones with potential hazard (caution areas) of larger quick clay landslides. The zones have been identified and delimited by Quaternary geological mapping (to identify areas with marine clay), geotechnical assessment of topography and coarse geotechnical surveys. The zones cover release areas for quick clay landslides (areas that can slide out); in more recent mapping, runout areas may also be included. The identified quick clay zones are classified into three hazard classes (high, medium and low) based on topographical, geotechnical and hydrological criteria. The zones are further classified into three consequence classes (high, medium and low) depending on the consequences a landslide would have for buildings and infrastructure. The zones are then classified into five risk classes derived from hazard level and consequence. Area of use The dataset is primarily intended as a basis for assessing quick clay landslide hazard at municipal plan level. It is also intended as an information basis for municipalities, landowners, developers and others, with a view to avoiding terrain interventions and activities that can trigger landslides. The mapped zones only show areas with a potential hazard of larger landslides (terrain difference of 15 m or more). There may be landslide-prone quick clay zones outside the identified zones. In all areas with marine clay deposits, general caution must be shown regarding possible quick clay landslides.
Quick Clay – Caution
Caution zones for quick clay landslides based on marine clay deposits and terrain criteria (height difference and slope). Data from Norges vassdrags- og energidirektorat (NVE). More detailed delimitation than the main layer Quick clay; also available under Risk. Shows areas that may be exposed to quick clay landslides, based on marine clay deposits and terrain criteria (slope and height difference). If the measure lies within the caution area, the procedure in NVE guideline 1/2019 must be followed and geotechnical expertise obtained. The map replaces the earlier "Aktsomhet marin leire" and now also captures terrain that can trigger landslides. The map is updated regularly and should be seen together with the hazard zone map for a full assessment.
Landslides
NVE caution maps for rockfall, snow avalanches and landslides, including landslide events and release and runout areas. Data from Norges vassdrags- og energidirektorat (NVE). Also available under Risk. Datasets: Landslides. Caution maps (rockfall, snow avalanche, quick clay, possibility of marine clay, earth flow), registered landslide events and rock avalanche hazard zones with return periods. Sources: NVE, NGI, NGU.
Radon susceptibility
Shows which areas in Norway are likely to be more exposed to radon than others, based on bedrock and loose masses. Data from Norges geologiske undersøkelse (NGU). Useful when buying and renting out housing: high susceptibility means a radon measurement is recommended before moving in. Datasets: Radon susceptibility. The national radon susceptibility map shows which areas in Norway are likely to be more exposed to radon than others. In areas marked as high susceptibility, at least 20% of homes are estimated to have radon concentrations above the recommended limit of 200 Bq/m³ on the ground floor. The dataset is based on indoor air measurements of radon (from the NRPA database) and knowledge of geological conditions (NGU's databases for bedrock and loose masses). In some areas, radon has been measured in many homes, while in others few measurements are available. The dataset was developed by assessing statistically how the share of homes with high radon concentrations relates to local geology, and by applying this knowledge to other areas with similar geological conditions. Area of use The national radon susceptibility map gives municipalities a basis for a first assessment of radon risk. In areas with high or particularly high susceptibility, the municipality should check whether radon needs follow-up under the Planning and Building Act and the Public Health Act and their regulations. The map cannot be used to predict the radon concentration in individual buildings. The only way to know for certain about radon in a building is to carry out a measurement.
Possibility of marine clay
Based on loose masses maps and the dataset for the marine border. Shows where marine clay may potentially be found, either at the surface or under other loose masses. Data from Norges geologiske undersøkelse (NGU). An important supplement to the Quick clay layer during geotechnical screening. Datasets: Possibility of marine clay. The "Mulighet for marin leire" (MML) dataset is based on loose mass maps and the marine limit (MG) dataset, and shows where marine clay may potentially be found, either at the surface or beneath other loose mass types.
Loose masses
The extent of the types of loose masses that cover the rock surface, classified by origin and type (moraine, sea and fjord deposits, river deposits and more). Data from Norges geologiske undersøkelse (NGU). The basis for understanding whether an area is dominated by stable moraine masses or sensitive marine clay. The loose mass data mainly shows the distribution of the loose mass types that cover the rock surface. Most of the loose masses were formed during and after the last ice age. The data only shows which soil type dominates in the top few metres of the terrain surface.
Groundwater (GRANADA)
The national groundwater database (GRANADA) with information about wells, springs, exploratory drilling, groundwater quality, depth to bedrock and borehole parks. Data from Norges geologiske undersøkelse (NGU). Useful when planning energy wells (ground-source heat) and when assessing groundwater resources in a development area. Datasets: Groundwater (GRANADA). National groundwater database: wells, springs, exploratory drillings, quality, depth to bedrock, borehole parks and monitoring.
Drainage lines
Drainage lines derived from hoydedata.no at 50 cm resolution, divided by upstream area (from 1-10 dekar to more than 1,000 dekar). Data from Geodata AS. Gives a picture of natural water flow across the terrain, useful when assessing surface water management and flood paths. Datasets: Drainage lines. The drainage lines are derived from hoydedata.no at a resolution of 50 cm. The lines cover about 99% of the country and are placed where water collects over an area larger than 1 daa (1,000 m²). Before the analysis, sinks in the terrain models were filled; buildings, culverts and drainage pipes have not been edited. The analyses were carried out by dividing the areas in the same way as NVE's Regine catchment areas, and the attributes from that dataset were then added to the lines.
Groundwater boreholes
National overview of drilled groundwater wells, energy wells and natural groundwater springs. Data from Geodata AS. The dataset gives a national overview of drilled groundwater wells, energy wells and natural groundwater springs.
Soil moisture
The height difference between a point and the nearest point calculated to be water-saturated, given in centimetres. Data from Geodata AS. A low value indicates a high groundwater table near the surface, relevant when assessing building ground and drainage. The soil moisture map states the height difference in centimetres between a point and the nearest point calculated to be water-saturated.
Bedrock
Modernised map service showing a continuous bedrock map at 1:250,000 covering the whole of Norway, with harmonised interpretation across map sheets. Structural survey points that give the orientation of the structures in the bedrock are included. Modernised map service showing a continuous bedrock map at 1:250,000 covering the whole of Norway, with harmonised interpretation across map sheets. Structural survey points that give the orientation of the structures in the bedrock are included. The 1:250,000 database and the map viewer now contain properties such as main rock type, nappe complex, formation and formation age. Area of use Knowledge of the bedrock is important for exploring for and assessing raw materials and natural resources, water supply, planning and building infrastructure, waste storage, land and environmental planning, construction work, alternative energy and assessment of natural hazards such as earthquakes and landslides.
Geology
Petroleum data for the continental shelf from Geodata's Petroleum Online Services, with blocks, quadrants, installations, pipelines and wells. Based on data from Sokkeldirektoratet, with equivalent data for the British, Dutch and Danish sectors.
Geology (combined)
Includes: mining rights, groundwater boreholes, gravel and crushed stone, loose masses, marine border, mineral resources, possibility of marine clay and radon susceptibility. Includes: mining rights, groundwater boreholes, gravel and crushed stone, loose masses, marine border, mineral resources, possibility of marine clay and radon susceptibility.
Bedrock, derived maps, NiN
Derived bedrock maps from NGU for Natur i Norge: forecast for lime content in the bedrock and the extent of ultramafic rocks. Lime-rich and ultramafic ground gives distinctive vegetation and is a basis for habitat type mapping. Derived bedrock maps from NGU for Natur i Norge: forecast for lime content in the bedrock and the extent of ultramafic rocks. Lime-rich and ultramafic ground gives distinctive vegetation and is a basis for habitat type mapping.
Drill cores
NGU's drill core archive: places where drill cores have been taken for bedrock, natural stone, metals and industrial minerals. An overview at a distance, individual cores when you zoom in. NGU's drill core archive: places where drill cores have been taken for bedrock, natural stone, metals and industrial minerals. An overview at a distance, individual cores when you zoom in.
Geochemistry
NGU's national geochemistry database: field samples of loose masses, stream sediments and water with analysed elements, and survey points with geochemical measurements. The samples are shown as an overview at a distance and individually when you zoom in. NGU's national geochemistry database: field samples of loose masses, stream sediments and water with analysed elements, and survey points with geochemical measurements. The samples are shown as an overview at a distance and individually when you zoom in.
Geosites, GNIST
NGU's register of geosites: localities with geological value for teaching, research, outdoor recreation and geotourism, shown as polygons and symbols at national, regional and local level depending on how far you have zoomed in. NGU's register of geosites: localities with geological value for teaching, research, outdoor recreation and geotourism, shown as polygons and symbols at national, regional and local level depending on how far you have zoomed in.
Landforms, NiN
NGU's landform map following Natur i Norge: clay ravines, clay landslide hollows, kettle holes, fossil deltas and earth pyramids as polygons, symbols and lines, with geotope value from negligible to very high. The details appear when you zoom in. NGU's landform map following Natur i Norge: clay ravines, clay landslide hollows, kettle holes, fossil deltas and earth pyramids as polygons, symbols and lines, with geotope value from negligible to very high. The details appear when you zoom in.
Permafrost
NGU's permafrost mapping: study areas with mapped permafrost and boreholes with temperature measurements in Norway and on Svalbard. The boreholes appear when you zoom in. NGU's permafrost mapping: study areas with mapped permafrost and boreholes with temperature measurements in Norway and on Svalbard. The boreholes appear when you zoom in.
The datasets behind
Geology datasets
Bedrock, derived maps, NiN
Derived bedrock maps from NGU for Natur i Norge: forecast for lime content in the bedrock and the extent of ultramafic rocks.
About the datasetBedrock N250
The map data is mainly based on the national printed bedrock geology map series at a scale of 1:250,000, and has since been harmonised across map sheet boundaries and updated with newer map data.
About the datasetBedrock N50
The maps are built on a combined interpretation of field observations, geophysical data, digital elevation models and aerial photos, along with analyses of collected samples.
About the datasetMining rights
Areas covered by mining rights for state-owned minerals under the Minerals Act: exploration rights (UN) and extraction rights (UT).
About the datasetDrill cores
NGU's drill core archive: places where drill cores have been taken for bedrock, natural stone, metals and industrial minerals.
About the datasetGeochemistry
NGU's national geochemical database: field samples of loose masses, stream sediments and water with analysed elements, and measurement points with geochemical measurements.
About the datasetGeology
About the datasetGeology (combined)
Includes: mining rights, groundwater boreholes, gravel and crushed stone, loose masses, marine border, mineral resources, possibility of marine clay and radon susceptibility.
About the datasetGeological heritage
Geological localities of particular value: landscape features, geosites and natural monuments that document Norway's geological history and diversity.
About the datasetHow do I turn on the geology layers in Fusion?
Click Map layers at the top right of the map, select the category in the list on the left and turn on the layer. You can have several layers on at once, over the same property.
Where do the layers come from?
The sources are listed in the table above, including Norges geologiske undersøkelse, Geodata AS, Norges vassdrags- og energidirektorat, Geodata AS. Datasets: Groundwater boreholes. Each layer shows its source and date.
Can I get the same data programmatically?
Yes. The datasets behind the layers are available in the Placepoint API and in Placepoint AI through MCP.
Other categories
The layers and descriptions come from the documentation, synced 16 October 2026.
Used where decisions really matter