








Map layers · 20 layers
Transport and communications, layer by layer over the property.
The Transport and communications category shows public transport routes and departure density, traffic volume on roads, vehicle statistics and parking. The layers are useful for assessing locations for retail, offices and logistics, for documenting traffic load in planning processes, and for assessing access by car and public transport.
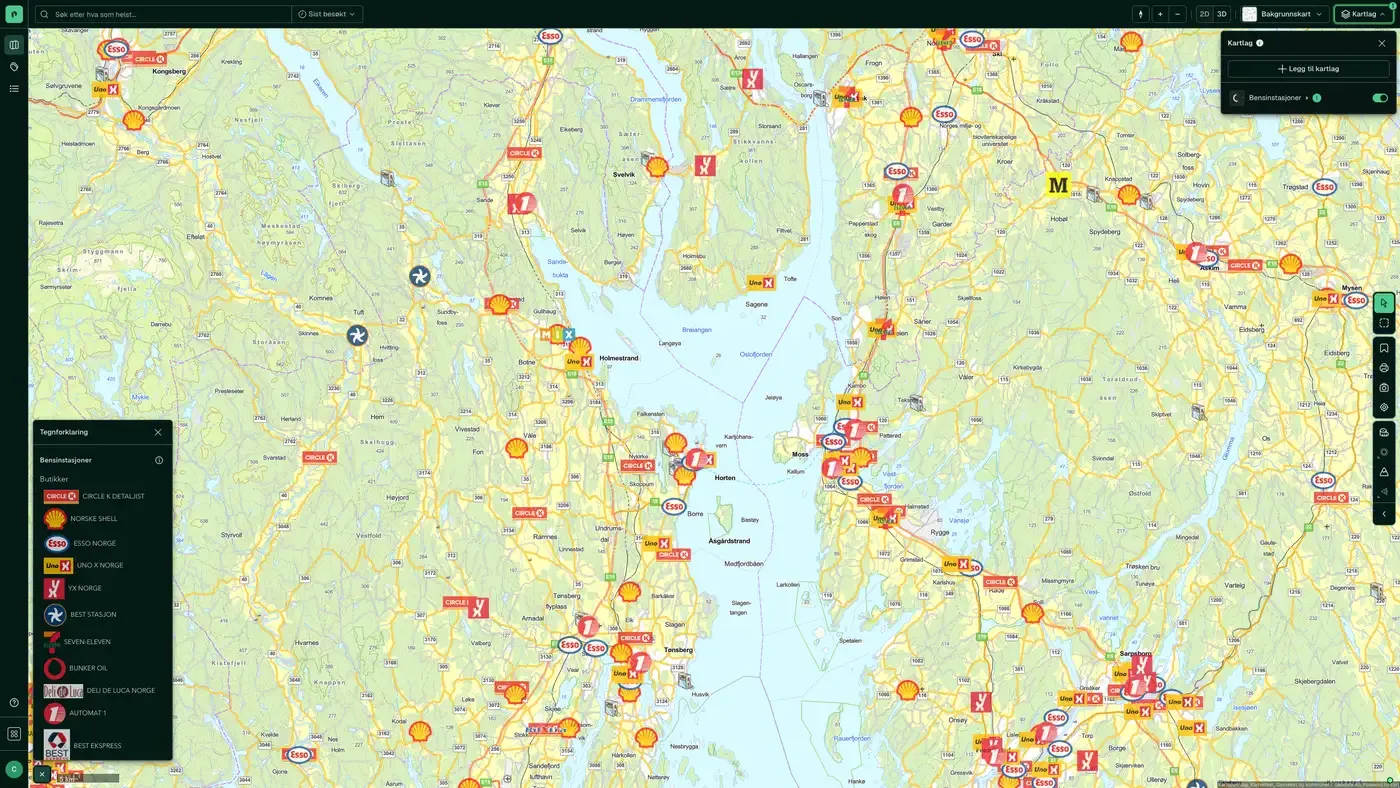
The layers
20 layers in Transport and communications
| Layer | Description | Source |
|---|---|---|
| Traffic volume | Representative ÅDT for road sections | Statens vegvesen |
| Public transport routes | Routes for bus, train, metro, tram, ferry and air | Entur. Datasets: Public transport routes |
| Public Transport Density | Departure density per area | Entur. Datasets: Public Transport Density |
| Road category, authority & speed limit | Road class, ownership and speed limit | Statens vegvesen |
| Road transport – classes & constraints | Load class, axle load and timber transport class | Statens vegvesen |
| Electric cars | Number of privately owned electric cars per basic statistical unit | Geodata AS |
| Parking and charging | Parking spaces and charging infrastructure | Geodata AS. Datasets: Parking and charging |
| EV charging stations | One point per charging point, coloured by operator and sized by power | Geodata AS, with NOBIL as the underlying source |
| Parking | Parking spaces coloured by parking provider and sized by type | Geodata AS, Statens vegvesen and Kartverket |
| Cars types | Number of cars per vehicle type | Geodata AS |
| Cars age | Average age of private cars | Geodata AS |
| Cars and fuel types | Share of electric, diesel, petrol and hybrid cars | Geodata AS |
| Cars brands | Heat map of car density by brand | Geodata AS |
| Walking Distance to Public Transport Stops | This map layer gives an overview of all public transport stops and the walking distance to them for different time intervals. | Placepoint |
| Building Limits from the Road's Center Line | Statutory building limits under section 29 of the Norwegian Roads Act | Statens vegvesen. Datasets: Building Limits from the Road's Center Line |
| Fuel stations | Contains information on chain, number of employees and accounts. | Geodata AS |
| Public transport stops | Bus, metro, tram, train and ferry/port | Entur |
| Traffic accidents – heat map | Heat map of accident hotspots | Statens vegvesen |
| Traffic accidents – temperature | Accident points with cause data | Statens vegvesen |
| Walking to the public transport stops | Our own analysis: an overview of all public transport stops and the walking distance to them in different time intervals | Placepoint |
Layer by layer
What each layer shows
Traffic volume
Shows representative ÅDT (annual average daily traffic) for road sections from Nasjonal vegdatabank (NVDB). Useful for assessing exposure along a retail road, noise load, and for documenting traffic volume in planning submissions. Combine it with Noise for a complete location assessment along busy roads. Shows representative traffic volume on road sections, given as annual average daily traffic (ÅDT).
Public transport routes
Routes and timetables for bus, train, metro, tram, ferry and air from Entur. It shows the route line itself, not departure density. Useful for seeing whether a property lies close to an existing route, and for mapping public transport coverage in a planning area. Routes and timetables for bus, train, metro, tram, ferry and air from Entur. Departure calculations are based on an average weekday. If the operators do not supply an accurate route geometry, Placepoint calculates the route with "low accuracy" (the stops are joined directly by a line).
Public Transport Density
Aggregated departure density (number of departures per hour) from Entur, visualised as a heat map. It gives a faster picture of public transport coverage than the Public transport routes layer, without having to interpret individual lines. Useful for retail location assessments where actual accessibility by public transport is a criterion. Departure density within a municipality (relative classes from lowest to highest). Updated annually.
Road category, authority & speed limit
Publicly and privately owned roads, road authority and speed limit. Data from NVDB. Shows ownership/authority (state, county, municipality, private), categories (europaveg, riksveg, fylkesveg, kommunal veg, privat veg, skogsbilveg) and the signposted speed limit. Weekly from NVDB.
Road transport – classes & constraints
NVDB data for planning road transport, load class and timber transport. Data from NVDB. NVDB map layer for timber transport, mobile crane list, modular road trains, special transport, normal transport, road barriers, rest areas, control and weighing stations, ferry quays, 24-hour rest areas, bridges, tunnels, height restrictions, railway crossings, toll stations and speed limits.
Electric cars
Number of privately owned electric cars from the Norwegian motor vehicle register. Datasets: Electric cars. Number of privately owned electric cars from the Norwegian motor vehicle register, aggregated to a 100 × 100 m grid. Updated annually.
Parking and charging
Parking spaces, conditional parking and charging stations from Geodata AS. The charging stations all share one symbol. If you want to see charging and parking separately, we now have two dedicated map layers: EV charging stations shows who operates each charging point and how much power it delivers, and Parking shows who operates the space and what type of parking it is. Public and private parking spaces (car parks, on-street parking, parking garages) from NVDB; electric car charging stations from NOBIL; rest areas with the number of spaces or the area. Updated weekly when the sources are updated.
EV charging stations
One point per charging point, from normal charging at 3.6 kW to rapid charging at 1,000 kW. Each point is coloured by operator: Recharge, Eviny, Mer, Circle K, Uno-X, Tesla and IONITY each have their own colour, while the rest are grouped as Other operators. The size of the point follows the power. Charging points at the same station share a coordinate, so clicking on the map steps through them one by one. Data from Geodata AS, with NOBIL as the underlying source. The layer covers electric charging, not biogas. One point per charging point from NOBIL, coloured by operator and sized by power, from 3.6 kW to 1,000 kW. Click a point to see the name, operator, owner, power, connector type, which vehicles the charger suits, whether it has a fixed cable, the number of charging points at the station, access, 24-hour opening, any parking fee, address, municipality, NOBIL ID and when the station was last updated in NOBIL.
Parking
Parking spaces from Parkeringsregisteret (the Norwegian parking register) via Geodata AS, supplemented with NVDB from Statens vegvesen and FKB from Kartverket. The colour shows who operates the space: APCOA, Onepark, Aimo Park, Park Nordic and Vestpark each have their own colour, municipal spaces share one colour, and the rest are grouped as other or unknown operator. Many spaces from NVDB and FKB have no parking provider recorded. The size of the dot shows the type: parking garages are largest, then delimited area, along the carriageway and other parking. The layer appears when you zoom in to 1:100,000 or closer. Parking spaces coloured by parking provider and sized by type. Click a space to see type, parking provider, spaces with and without a fee, spaces for people with reduced mobility, charging spaces, park and ride, area, use, owner, address and source.
Cars types
Number of cars per type, with density setting the colour of the map. Data from the Norwegian motor vehicle register. Datasets: Cars types. The map layer shows the number of cars per type; the density sets the colour of the map. Types included: - passenger car - van - small bus - large bus - small lorry - large lorry - tractor - motorised equipment - moped - motorcycle - snowmobile - drawbar trailer - towed trailer - semi-trailer
Cars age
Information about privately owned cars from the Norwegian motor vehicle register. Datasets: Cars age. The map layer contains information about privately owned cars taken from the Norwegian motor vehicle register. The data is dotted so that individual car owners cannot be identified. The average age of the cars sets the colour of the map.
Cars and fuel types
Number of cars per fuel type. Data from the Norwegian motor vehicle register. Datasets: Cars and fuel types. The map layer shows the number of cars per fuel type; the highest value sets the colour of the map. Fuel types included: - petrol - diesel - paraffin - gas - electric - hydrogen - petrol hybrid - diesel hybrid - biodiesel - biopetrol - methanol - ethanol - other
Cars brands
Heat map of car density by brand. Data from the Norwegian motor vehicle register. Datasets: Cars brands. The heat map uses colour shades to show places with a higher or lower density of cars. It also contains information about car brands that you can filter on.
Building Limits from the Road's Center Line
The Road Act's general building limits from the road centre line for europavei, riksveg, fylkesveg and kommunal veg, under section 29 of the Road Act. Inside the building limit you need a dispensation from Statens vegvesen. The layer is an important planning consideration when developing close to existing roads. Data from Statens vegvesen. The map layer shows the Road Act's general building limits for all roads in the categories europavei, riksveg, fylkesveg and kommunal veg, based on data in NVDB (Nasjonal vegdatabank). Private roads are not included, and municipal planning provisions are not reflected. Tunnels are shown with a building limit even though it formally does not apply above ground. Where this occurs, we recommend filtering out the road category for the tunnel. If the building limit is not set in a zoning plan or in the provisions to the land use element of the municipal master plan, the Road Act's general building limits apply. The map layer shows building limits measured from the centre of the road: • 100 metres to europavei • 50 metres to riksveg • 50 metres to fylkesveg • 15 metres to kommunal veg • 15 metres to a pedestrian and cycle path If the zoning plan has no building limit drawn in, or no provisions on the building limit towards the road, the year of the zoning plan applies (this is not reflected in the map layer). Statens vegvesen, the county authority or the municipality handles applications for dispensation from the building limit.
Traffic accidents – heat map
An aggregated heat map of places with many registered personal injury accidents. It gives a quick overview of hazardous road sections without having to read individual points. Also available under Risk. A heat map that highlights places with frequent accidents. It includes information about the accident location, weather conditions and the extent of injuries. It mainly covers accidents involving personal injury.
Traffic accidents – temperature
An event-based map with information about the accident location, weather conditions and the extent of injuries for personal injury accidents. Also available under Risk. Information about the accident location, weather conditions and the extent of injuries, mainly for accidents involving personal injury.
Public transport stops
Bus, metro, tram, train and ferry/port from Entur. Shows the physical location of stops and stations. Also available under Infrastructure and included in the Family and accessibility combination. Datasets: Public transport stops. Bus, metro, tram, train and ferry/port stops from Entur. Weekly updates when the source updates.
Walking to the public transport stops
Placepoint's own analysis: an overview of all public transport stops and the associated walking distance across different time intervals. Source: Walking Distance to Public Transport Stops. Use it to assess public transport coverage for housing and commercial projects. It supplements Public transport stops, which only shows the points. The map layer gives you an overview of all public transport stops and the associated walking distance for different time intervals. Useful for urban planners, transport authorities, developers and builders when assessing access to public transport. Update frequency The data is updated monthly.
The datasets behind
Datasets in transport and communications
Cars age
Average age of privately owned cars in an area, based on Statens vegvesen's motor vehicle register.
About the datasetCars and fuel types
Number of cars per fuel type in each area, based on Statens vegvesen's motor vehicle register.
About the datasetCars brands
Heat map of car density with the breakdown by car brand, based on Statens vegvesen's motor vehicle register.
About the datasetCars types
Number of cars per vehicle type in each area, based on Statens vegvesen's motor vehicle register.
About the datasetBuilding Limits from the Road's Center Line
The Roads Act sets general building limits measured from the centre line of all public roads. This legal boundary sets how close to the road you can build without a specific exemption.
About the datasetElectric cars
Number of privately owned electric cars per 100 x 100 m grid cell, taken from Statens vegvesen's motor vehicle register and anonymised and aggregated.
About the datasetPublic transport stops
Public transport stops for bus, metro, tram, train, ferry and port from Entur, the state-owned company that runs Norway's national hub for public transport data.
About the datasetPublic Transport Density
Placepoint's classification of public transport departure density within each municipality, in five levels: Highest, High, Medium, Low, Lowest.
About the datasetPublic transport routes
Public transport routes for bus, train, metro, tram, ferry and air from Entur, combined from all public transport operators in Norway and published as open data.
About the datasetHow do I turn on the transport and communications layers in Fusion?
Click Map layers at the top right of the map, select the category in the list on the left and turn on the layer. You can have several layers on at once, over the same property.
Where do the layers come from?
The sources are listed in the table above, including Statens vegvesen, Entur. Datasets: Public transport routes, Entur. Datasets: Public Transport Density, Geodata AS. Each layer shows its source and date.
Can I get the same data programmatically?
Yes. The datasets behind the layers are available in the Placepoint API and in Placepoint AI through MCP.
Other categories
The layers and descriptions come from the documentation, synced 16 October 2026.
Used where decisions really matter