








Map layers · 5 layers
Pollution, layer by layer over the property.
The Pollution category brings layers for contaminated land and noise together in one place. It is useful for a complete environmental review of a property or a plan area, either as part of due diligence when buying or to prepare for a zoning plan process where environmental considerations must be documented.
The layers
5 layers in Pollution
| Layer | Description | Source |
|---|---|---|
| Contaminated land | Properties with contaminated land and landfills | Miljødirektoratet |
| Rail/metro/tram noise | Calculated average noise from railways and light rail | Miljødirektoratet |
| Noise mapping (T-1442) | Noise warning map with yellow and red zones | Miljødirektoratet |
| Soil Contamination – Areas | The service covers properties with contaminated land as well as municipal and private/industrial landfills | Miljødirektoratet |
| Road noise | Average day-evening-night noise (Lden) from road traffic at 4 metres above ground | Miljødirektoratet |
Layer by layer
What each layer shows
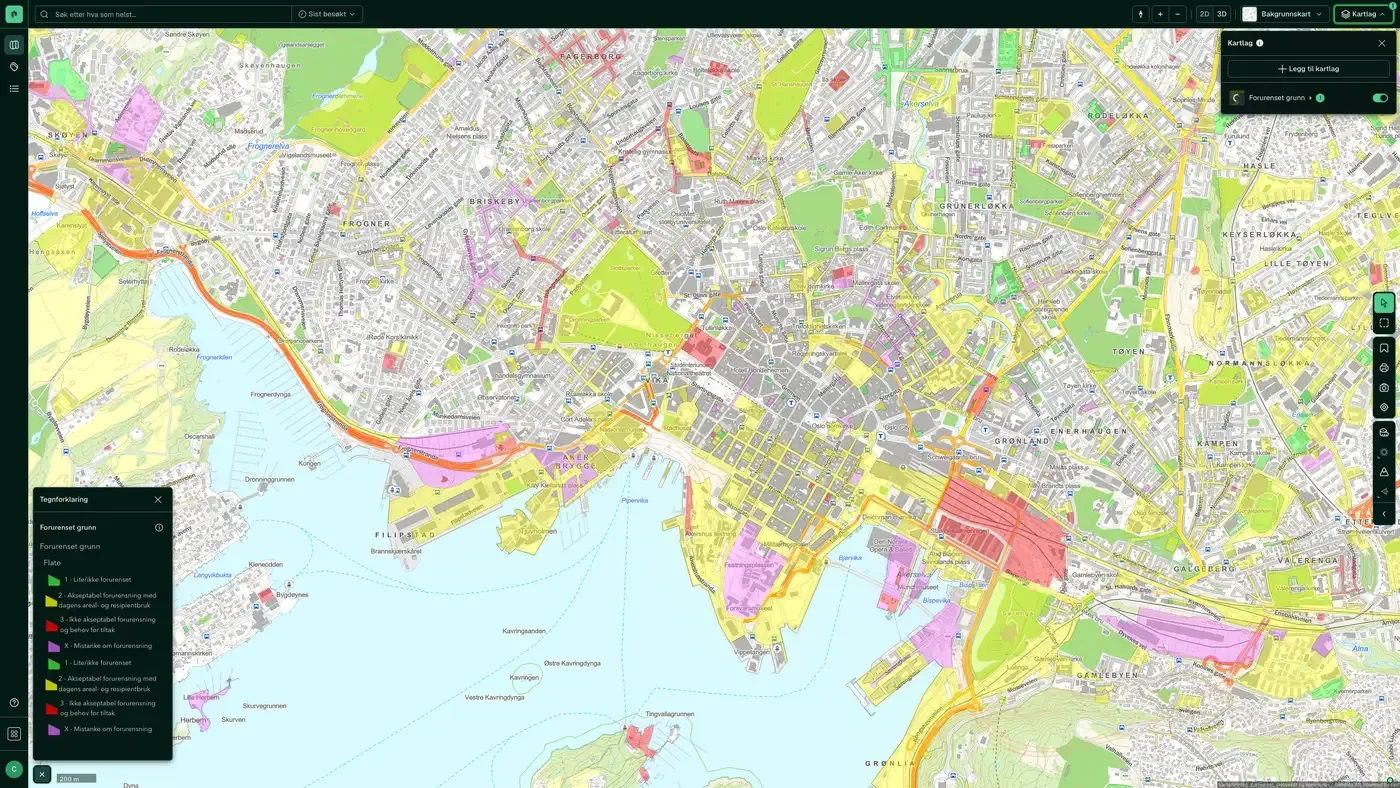
Contaminated land
Shows properties registered with contaminated land in the Miljødirektoratet database, as well as municipal and private landfills. A property on the list does not necessarily mean that ground pollution has been confirmed at a harmful level, but that historical activity or suspicion has been registered and needs to be clarified. For development on or near such properties, the authorities normally require an environmental ground survey. The register is not complete: properties with historical industrial activity may be missing an entry, especially for older industry. A negative search is not a clean bill of health.
Rail/metro/tram noise
Calculated average noise from railways and light rail. See Noise for the full description. Average Lden noise from railways at a height of 4 metres. Modelled data, showing lines with at least 30,000 trains per year outside the cities (the situation around 2016).
Noise mapping (T-1442)
Noise warning map with yellow and red zones under the national guideline. See Noise for the full description. Forecasts for red (Lden>65 dB) and yellow (Lden>55 dB) noise zones along national and county roads, calculated with NorStøy (Nord2000Road) based on traffic data from NVDB.
Soil Contamination – Areas
The service covers properties with contaminated land as well as municipal and private/industrial landfills. The dataset comes from mapping of sites with confirmed or suspected ground pollution and from reports made in connection with building and excavation cases, required surveys or voluntary submissions. The service covers properties with contaminated land as well as municipal and private/industrial landfills. The dataset comes from mapping of sites with confirmed or suspected ground pollution and from reports made in connection with building and excavation cases, required surveys or voluntary submissions.
Road noise
Average day-evening-night noise (Lden) from road traffic at 4 metres above ground. Modelled values, not measurements. Average day-evening-night noise (Lden) from road traffic at 4 metres above ground. Modelled values, not measurements.
The datasets behind
Datasets in Pollution
Contaminated land
Properties registered with contaminated land, and municipal and private/industrial landfills.
About the datasetSoil Contamination – Areas
The service covers properties with contaminated land and municipal and private/industrial landfills.
About the datasetRail/metro/tram noise
Calculated average noise from railways (including metro and tram) at 4 metres above ground.
About the datasetRoad noise
Calculated average road traffic noise at 4 metres above ground, from roads with at least 3 million vehicle passes per year (AADT 8,200+).
About the datasetNoise mapping (T-1442)
Noise warning maps under Guideline T-1442, the official guidance on handling noise in land-use planning.
About the datasetHow do I turn on the pollution layers in Fusion?
Click Map layers at the top right of the map, select the category in the list on the left and turn on the layer. You can have several layers on at once, over the same property.
Where do the layers come from?
The sources are listed in the table above, including Miljødirektoratet. Each layer shows its source and date.
Can I get the same data programmatically?
Yes. The datasets behind the layers are available in the Placepoint API and in Placepoint AI through MCP.
Other categories
The layers and descriptions come from the documentation, synced 16 October 2026.
Used where decisions really matter