








Map layers · 10 layers
Energy, layer by layer over the property.
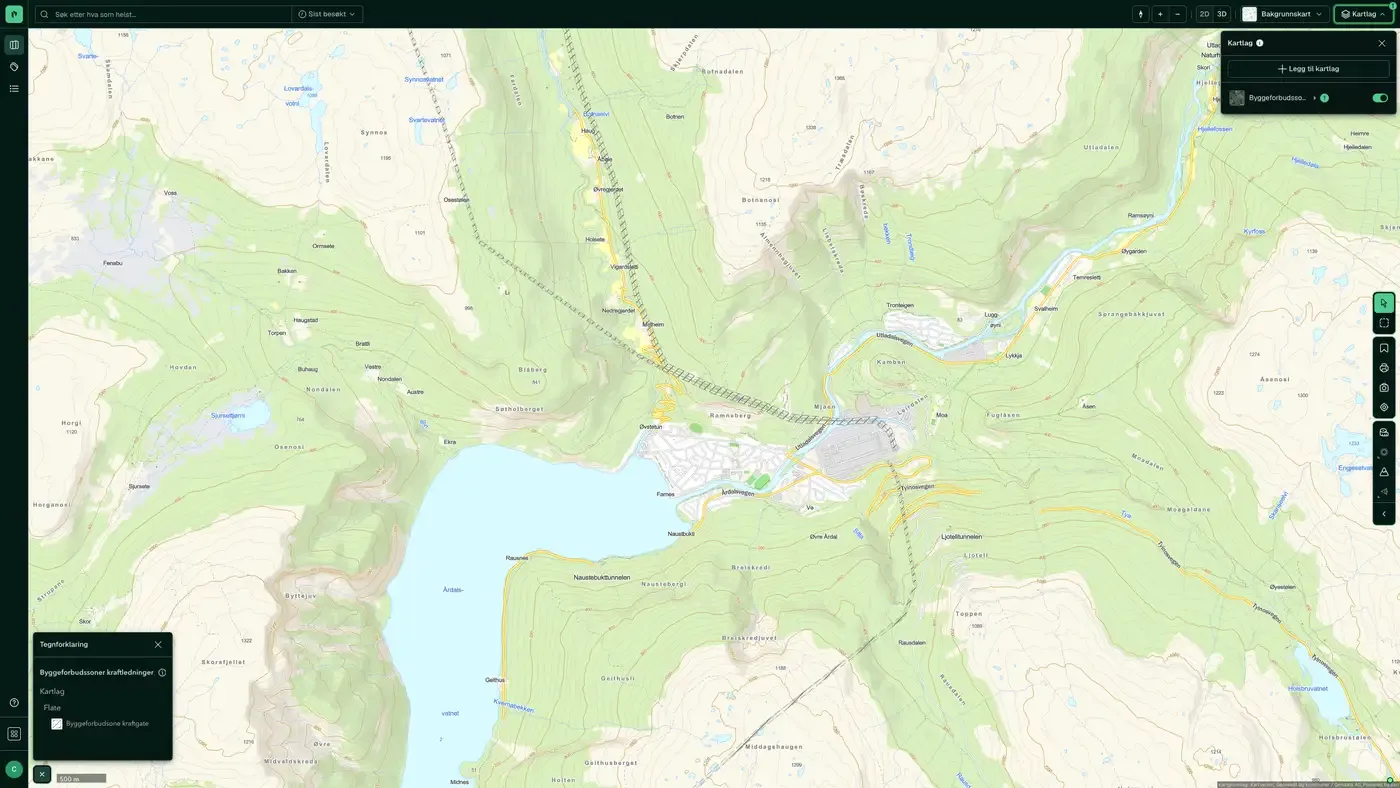
The Energy category shows the power grid, licensed energy production and building prohibition zones along power lines in Norway. The layers are useful in planning assessments where existing infrastructure can affect how much of a site can be developed or set a building limit, and for mapping grid capacity in a development area.
The layers
10 layers in Energy
| Layer | Description | Source |
|---|---|---|
| Building prohibition zones – power lines | Safety zones along high-voltage lines where building is restricted | Norges vassdrags- og energidirektorat (NVE). Dataset: Building prohibition zones – power lines |
| Grid installations | All lines, cables and substations in the power grid | Norges vassdrags- og energidirektorat |
| Substations, towers, poles & licences | Substations, towers, poles and associated licences | Norges vassdrags- og energidirektorat (NVE). Datasets: Substations, towers, poles & licences |
| Wind power | Licensable wind power plants that are fully processed or under processing | Norges vassdrags- og energidirektorat (NVE) |
| Hydropower | Developed and planned hydropower | Norges vassdrags- og energidirektorat (NVE) |
| Planned Electrical Installations in the Power System | Planned electrical installations and power lines that have not yet been built | Norges vassdrags- og energidirektorat (NVE). Datasets: Planned Electrical Installations in the Power System |
| Grid connection queue | Grid capacity that is reserved or queued, per substation | Statnett. Datasets: Grid connection queue |
| District heating | District heating licence areas, with status, and industry, data centres and waste incineration that can supply surplus heat | Norges vassdrags- og energidirektorat (NVE) |
| Solar resources | Average annual solar irradiation in a 3 × 3 km grid | Norges vassdrags- og energidirektorat (NVE) |
| Small hydropower potential | Mapped potential for small hydropower plants, with intake point, waterway and cost | Norges vassdrags- og energidirektorat (NVE) |
Layer by layer
What each layer shows
Building prohibition zones – power lines
Safety zones along high-voltage lines where building is restricted or prohibited. The zones are set by Norges vassdrags- og energidirektorat (NVE) and vary with voltage level (typically 17 m for 132 kV, 20 m for 300 kV, 25 m for 420 kV). Use the layer early in a planning assessment to see whether a site has buildable area within restricted corridors. Statnett's buffer zones around high-voltage lines with restrictions on new buildings and construction work. A separate duty to notify applies to work within 30 m of the outermost live conductor.
Grid installations
Shows all lines, cables and substations registered in Netbas (Volue), the national power grid register. Useful for mapping whether a site lies close to high-voltage lines (which typically brings building distance requirements) or for assessing grid connection for larger development projects. Power lines above 132 kV normally have a safety distance that limits buildability. Datasets: Grid installations. Digitised lines, cables and substations in Netbas (publicly available data only). Updated continuously by NVE.
Planned Electrical Installations in the Power System
Planned electrical installations and power lines that have not yet been built. Relevant for future land use planning and for seeing whether licences have been granted for routes near a property. Data from Norges vassdrags- og energidirektorat (NVE). Planned electrical installations in the power system The map layer shows electrical installations and power lines that have been granted a licence or are at various stages of licence processing, but that have not yet been built. Each object is assigned one of the following statuses:
Wind power
Licensable wind power plants fully processed or under processing by Norges vassdrags- og energidirektorat (NVE). Shows the location and status of wind farms. Useful for assessing proximity to wind power installations when buying property in coastal areas and in the mountains. Datasets: Wind power. Wind power plants subject to licensing that NVE has finished processing, including installations under construction and in operation. Weekly updates when owners update.
Hydropower
Developed and planned hydropower, including reservoirs and power stations, managed by Norges vassdrags- og energidirektorat (NVE). Useful for seeing whether a nearby watercourse is regulated or protected. Datasets: Hydropower. Developed and undeveloped hydropower installations, dams and regulated lakes as managed by NVE, including licence processes and remaining potential.
Substations, towers, poles & licences
Detailed view of substations, towers, poles and associated licences from Norges vassdrags- og energidirektorat (NVE). A supplement to the Grid installations layer for a more granular view of individual components in the infrastructure. The location of substations, towers/poles and related licences from NVE's grid installation dataset (public subset). Weekly updates when the owner updates.
Grid connection queue
Grid capacity that is reserved or queued with Statnett, aggregated per substation. The circle shows how much capacity is tied up at the point, how many cases are competing for the same station, the largest single case and the next planned connection. Use the layer early for power-intensive projects: a site can be zoned and available, but unsuitable because the capacity at the nearest station is already taken. The point is the substation, not the project site.
Small hydropower potential
Mapped potential for small hydropower plants, with an intake point and waterway for each project and an estimated development cost. The layer shows where hydropower can be developed, not what has been built, so read it as an opportunity analysis and not as a register of installations. Source: Norges vassdrags- og energidirektorat (NVE). Mapped potential for small hydropower plants, with an intake point and waterway for each project and an estimated development cost. Shows where hydropower can be developed, not what has been built. Source: NVE.
District heating
Areas with a licence or licence application for district heating from Norges vassdrags- og energidirektorat (NVE). The colour of the area shows the status of the licence, and clicking gives you the company, the installation, the municipality and links to the licence map. Three sublayers show industry, data centres and waste incineration that can supply surplus heat to a district heating network. Use the layer when you assess the energy solution for a new building: if the site lies in a licence area, the developer normally has a duty to connect under the plan- og bygningsloven, and proximity to a heat source tells you something about where the network can grow. Areas with a licence or licence application for district heating. The colour shows the status of the licence. Also shows industry, data centres and waste incineration that can supply surplus heat. Source: NVE.
Solar resources
Average annual solar irradiation in kWh/m² for the period 1991 to 2020, from Norges vassdrags- og energidirektorat (NVE). The grid is 3 × 3 km, so the layer shows differences between regions and parts of the country, not between individual buildings. Click a cell to read the value. Use it as a first check of the solar power potential for a portfolio spread across the country; for a single building, the roof surface, orientation and shadow from neighbouring buildings tell you more, see solstudie and the Daylight and Shadow tools. Average annual solar irradiation in kWh/m², for the period 1991-2020. The grid is 3 × 3 km and shows differences between regions, not between individual buildings. Source: NVE.
The datasets behind
Energy datasets
District heating
Areas with a licence or a licence application for district heating.
About the datasetSmall hydropower potential
Mapped potential for small hydropower plants, with the intake point and waterway for each project and an estimated development cost.
About the datasetSolar resources
Average annual solar irradiation in kWh/m², for the period 1991 to 2020.
About the datasetGrid connection queue
Transmission grid capacity tied up in Statnett's connection cases, totalled per substation.
About the datasetHow do I turn on the energy layers in Fusion?
Click Map layers at the top right of the map, select the category in the list on the left and turn on the layer. You can have several layers on at once, over the same property.
Where do the layers come from?
The sources are listed in the table above, including Norges vassdrags- og energidirektorat (NVE). Datasets: Building prohibition zones – power lines, Norges vassdrags- og energidirektorat, Norges vassdrags- og energidirektorat (NVE). Datasets: Substations, towers, poles & licences, Norges vassdrags- og energidirektorat (NVE). Each layer shows its source and date.
Can I get the same data programmatically?
Yes. The datasets behind the layers are available in the Placepoint API and in Placepoint AI through MCP.
Other categories
The layers and descriptions come from the documentation, synced 16 October 2026.
Used where decisions really matter