








Datasets · Energy
Solar resources, already linked to every property.
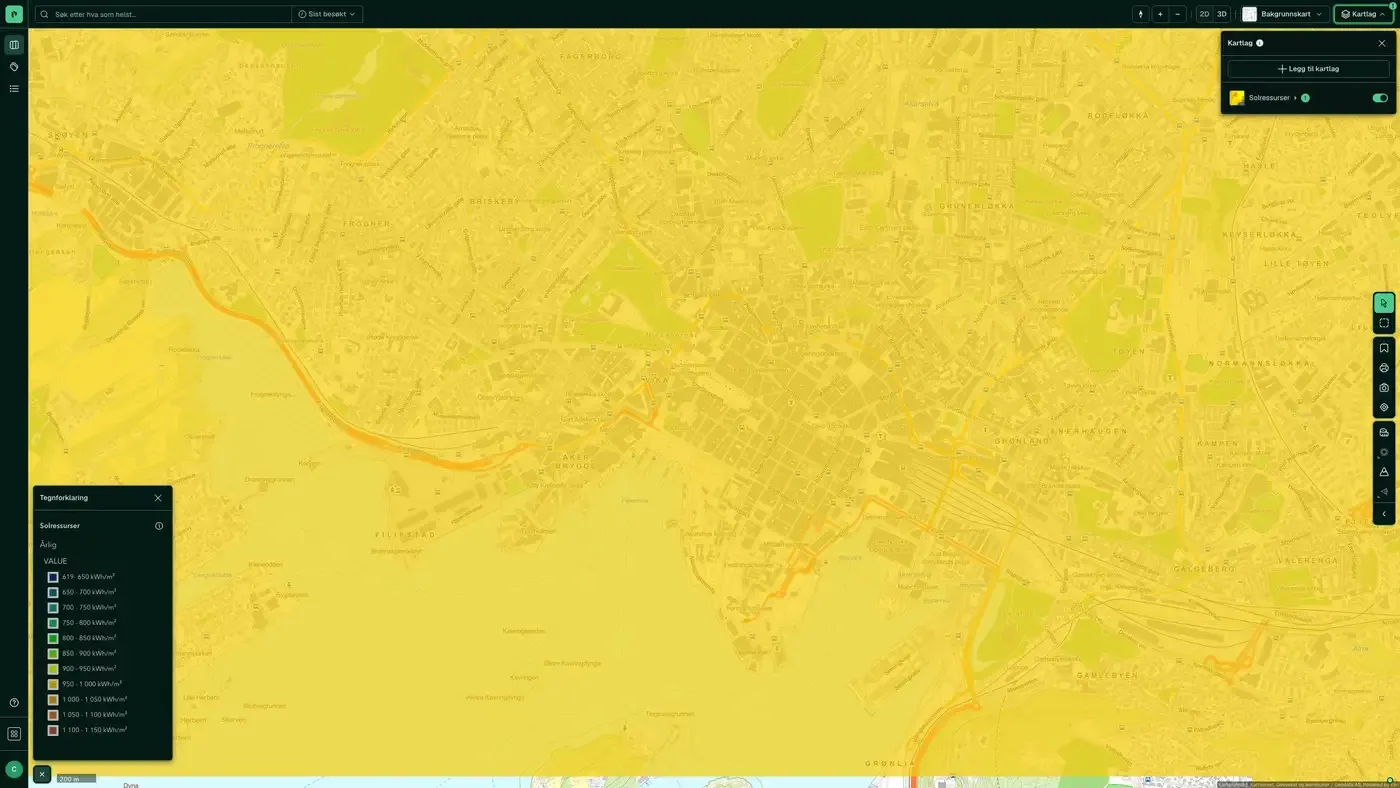
Average annual solar irradiation in kWh/m², for the period 1991-2020. The grid is 3 × 3 km and shows differences between regions, not between individual buildings.
What the dataset contains
Solar resources in Placepoint
Average annual solar irradiation in kWh/m², for the period 1991-2020. The grid is 3 × 3 km and shows differences between regions, not between individual buildings. Source: Norges vassdrags- og energidirektorat (NVE). Part of the Energy map layers in Placepoint.
This text is based on the dataset documentation, synced 16 October 2026.
More in the Energy map layer
Datasets often read together
District heating
Areas with a licence or a licence application for district heating.
About the datasetSmall hydropower potential
Mapped potential for small hydropower plants, with the intake point and waterway for each project and an estimated development cost.
About the datasetGrid connection queue
Transmission grid capacity tied up in Statnett's connection cases, totalled per substation.
About the datasetHow often is Solar resources updated?
The update frequency follows the source and is shown on the dataset in Placepoint.
Where does the data come from?
From Norges vassdrags- og energidirektorat. We collect and quality-check the data, then link it to the right property, with source and date on every field.
How do I see Solar resources on a property?
Look up the address in Fusion and turn on the Energy map layer. The dataset is there as a separate layer, and the details appear in the property panel when you click on the map.
Can I get the dataset programmatically?
Yes. The same data is available in Placepoint API and in Placepoint AI through MCP, so you can bring it into your own systems and agents.
Used where decisions really matter