









Phase 3 of 5: Sell
A prospectus with figures you can document.
A prospectus is only as good as the facts behind it. Here is what needs to be in place before the property goes on the market.
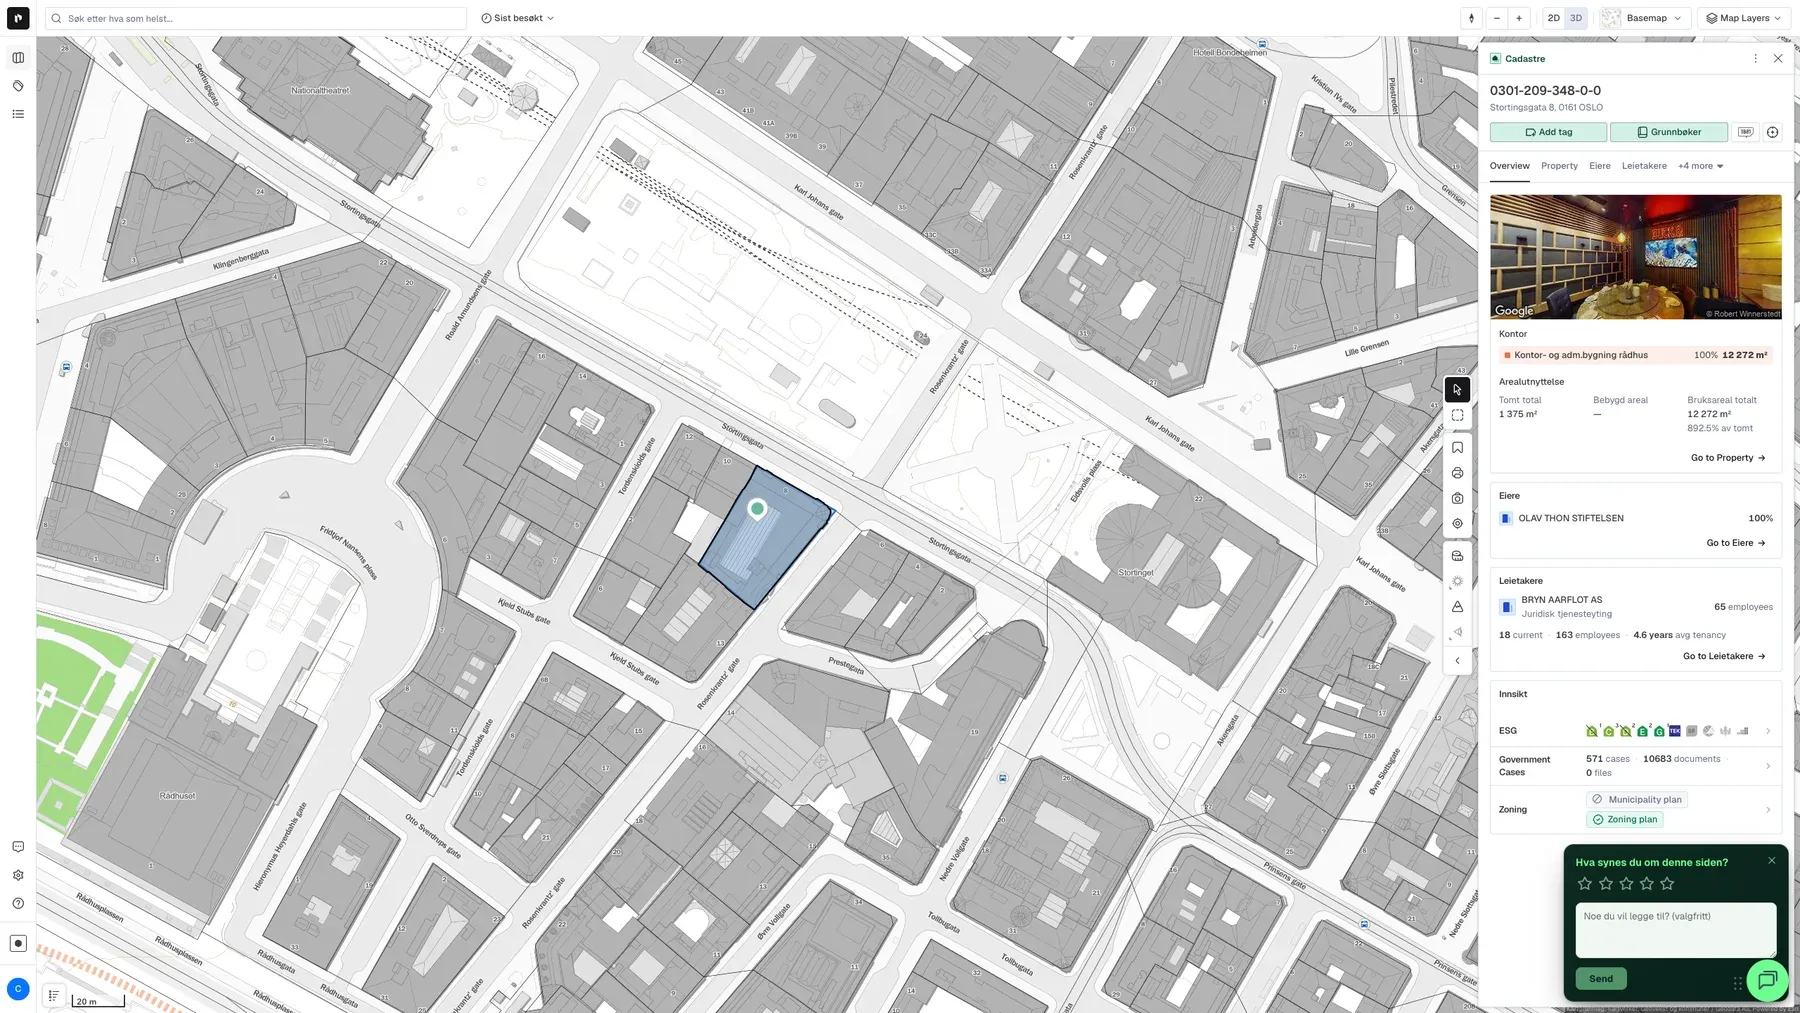
Used where decisions really matter






The questions that need answers
Before you sell: where to find the answers
Each question has one place in Placepoint where you find the answer, with the source shown.
What are the comparable transactions in the area?
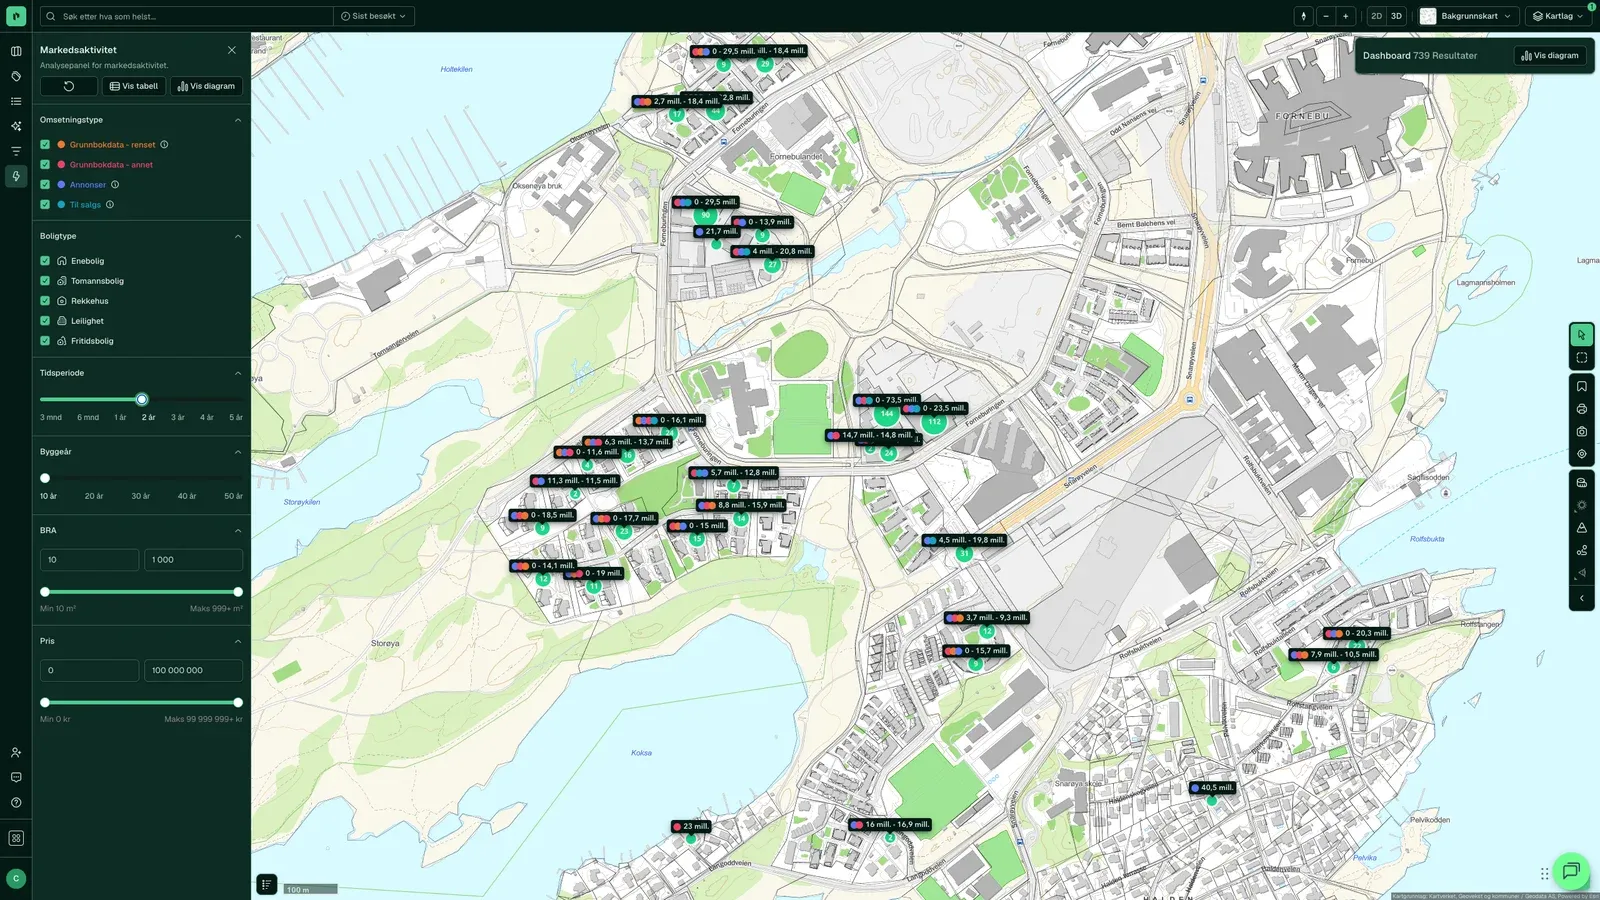
The Valuation tab and Market ActivityValuation Comparable Sales with price, date and area, and market activity in the area shown as clusters on the map.
Source: Kartverket, around 240,000 registered ownership changes a yearHow does the building compare with the neighbourhood on energy and standard?
The ESG tabEnergy label, built year and area for the building and its neighbours, so the prospectus can make documented claims about the building's standard.
Source: Enova and the matrikkel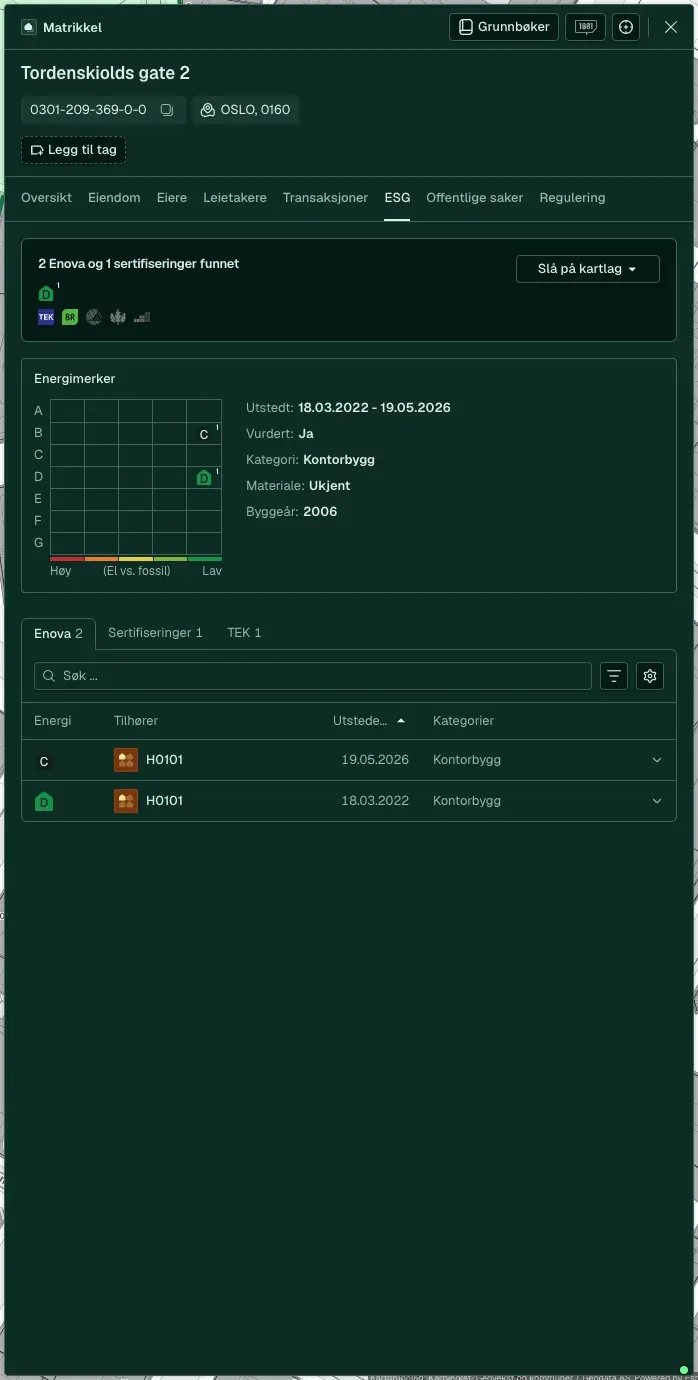
Who are the likely buyers, and what do they already own?
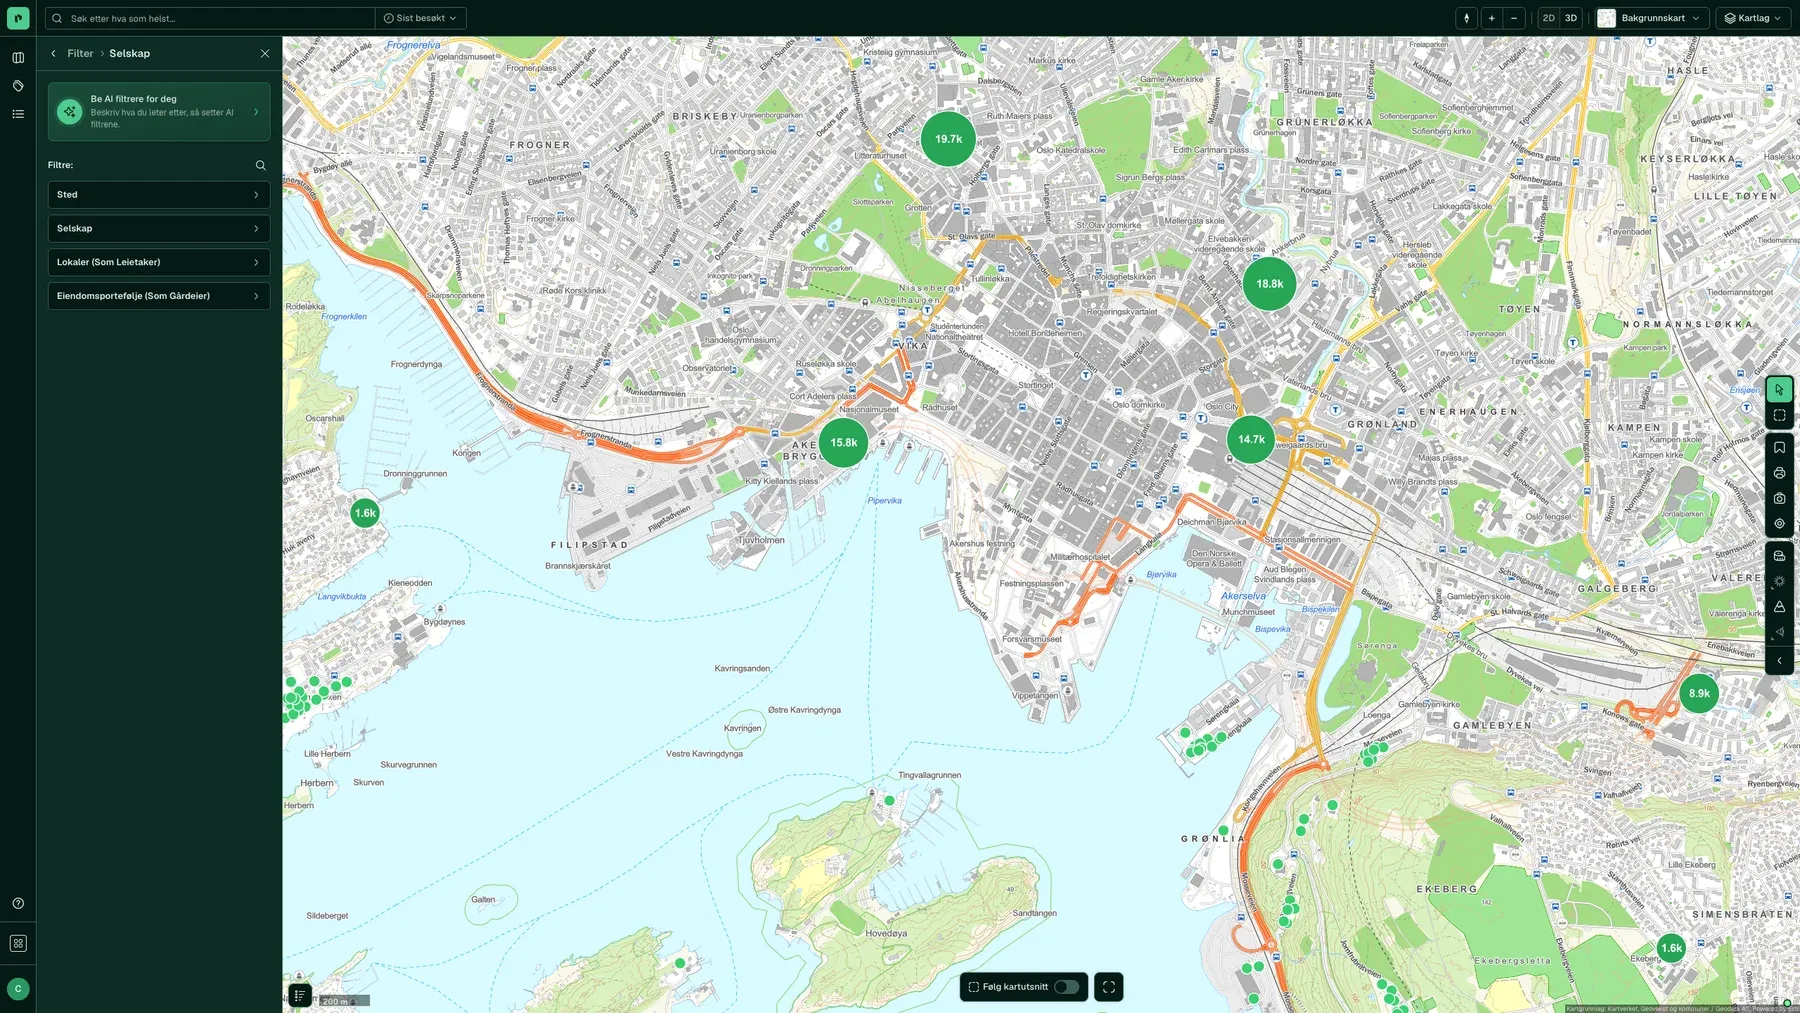
The Companies panel and FilterFind the owners already present in the area or segment, and see their portfolio before you call.
Source: Grunnboken and Enhetsregisteret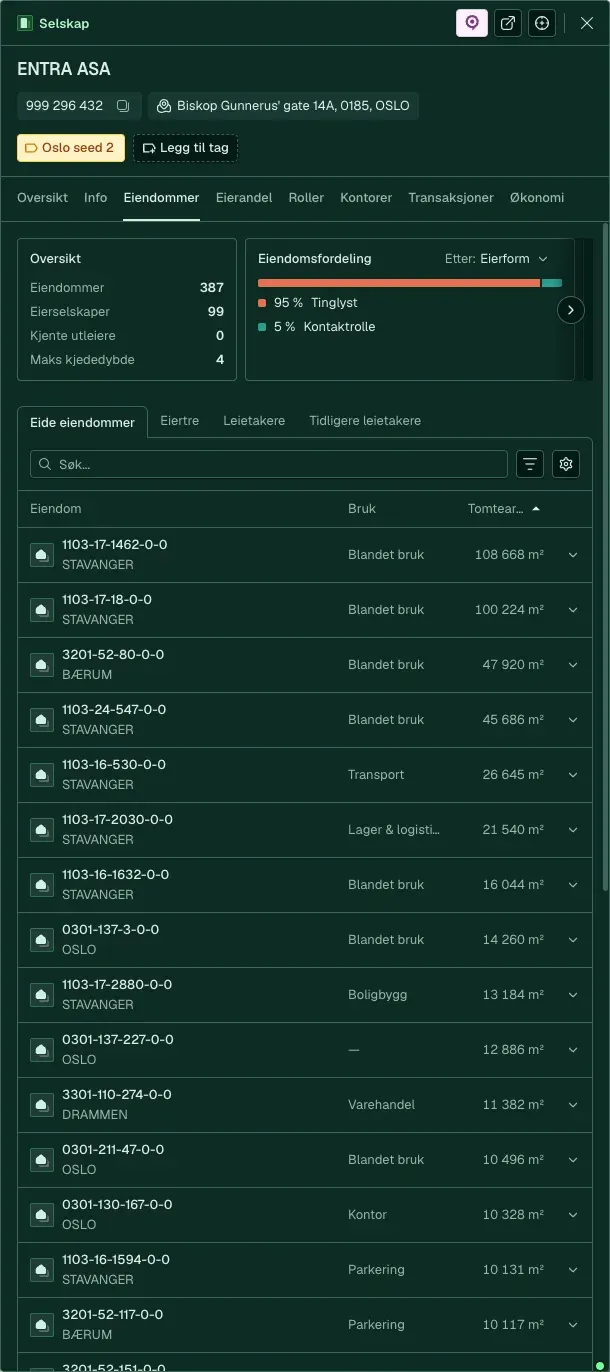
Which map views and analyses go into the prospectus?
Report and exportArea Score, demographics, transport and map views to PDF, with a source for every number.
Source: SSB, Entur, Kartverket and Placepoint's analyses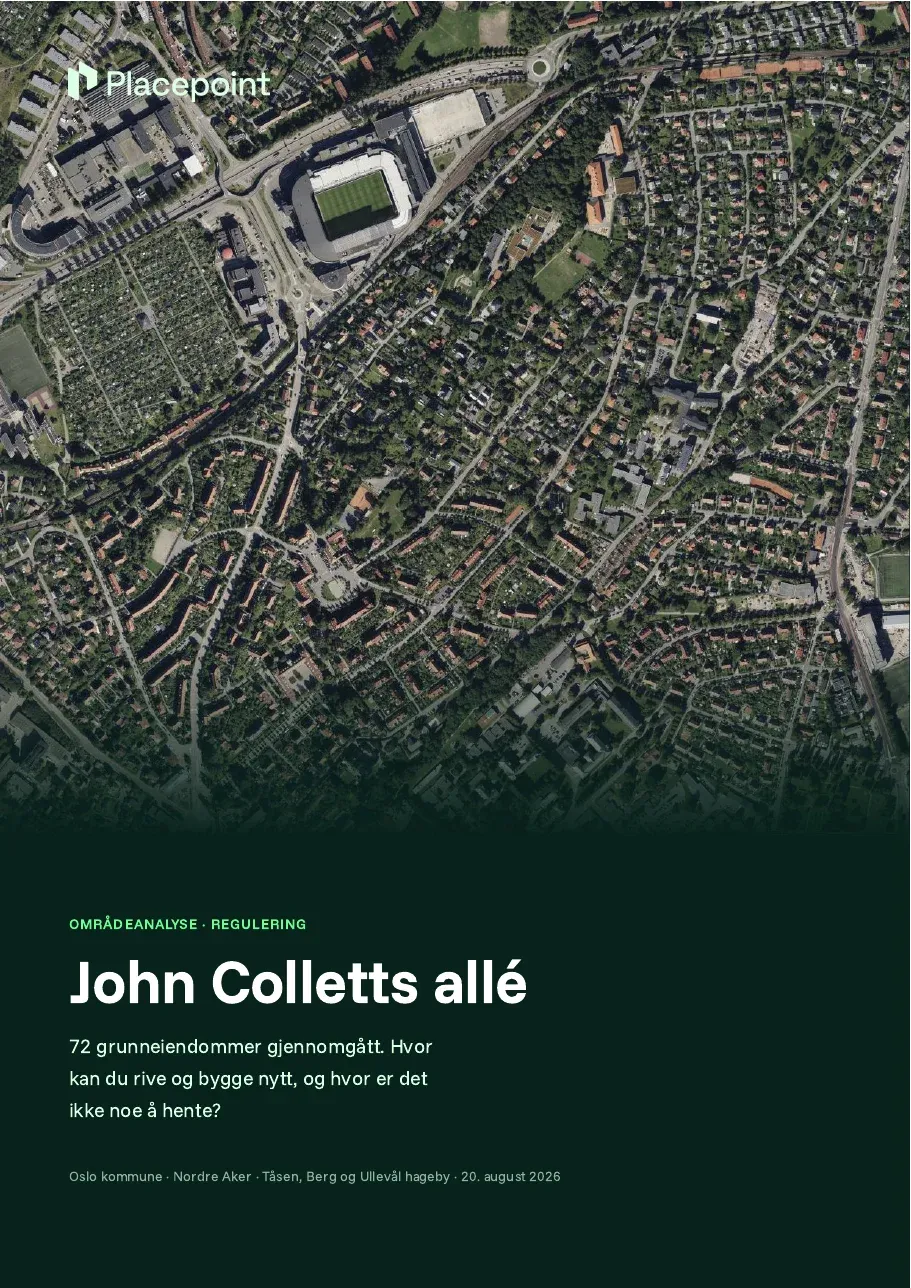
How to do it
From first search to sale
Five steps, as they look in Fusion. The screenshots show the feature, not the customer's own data.
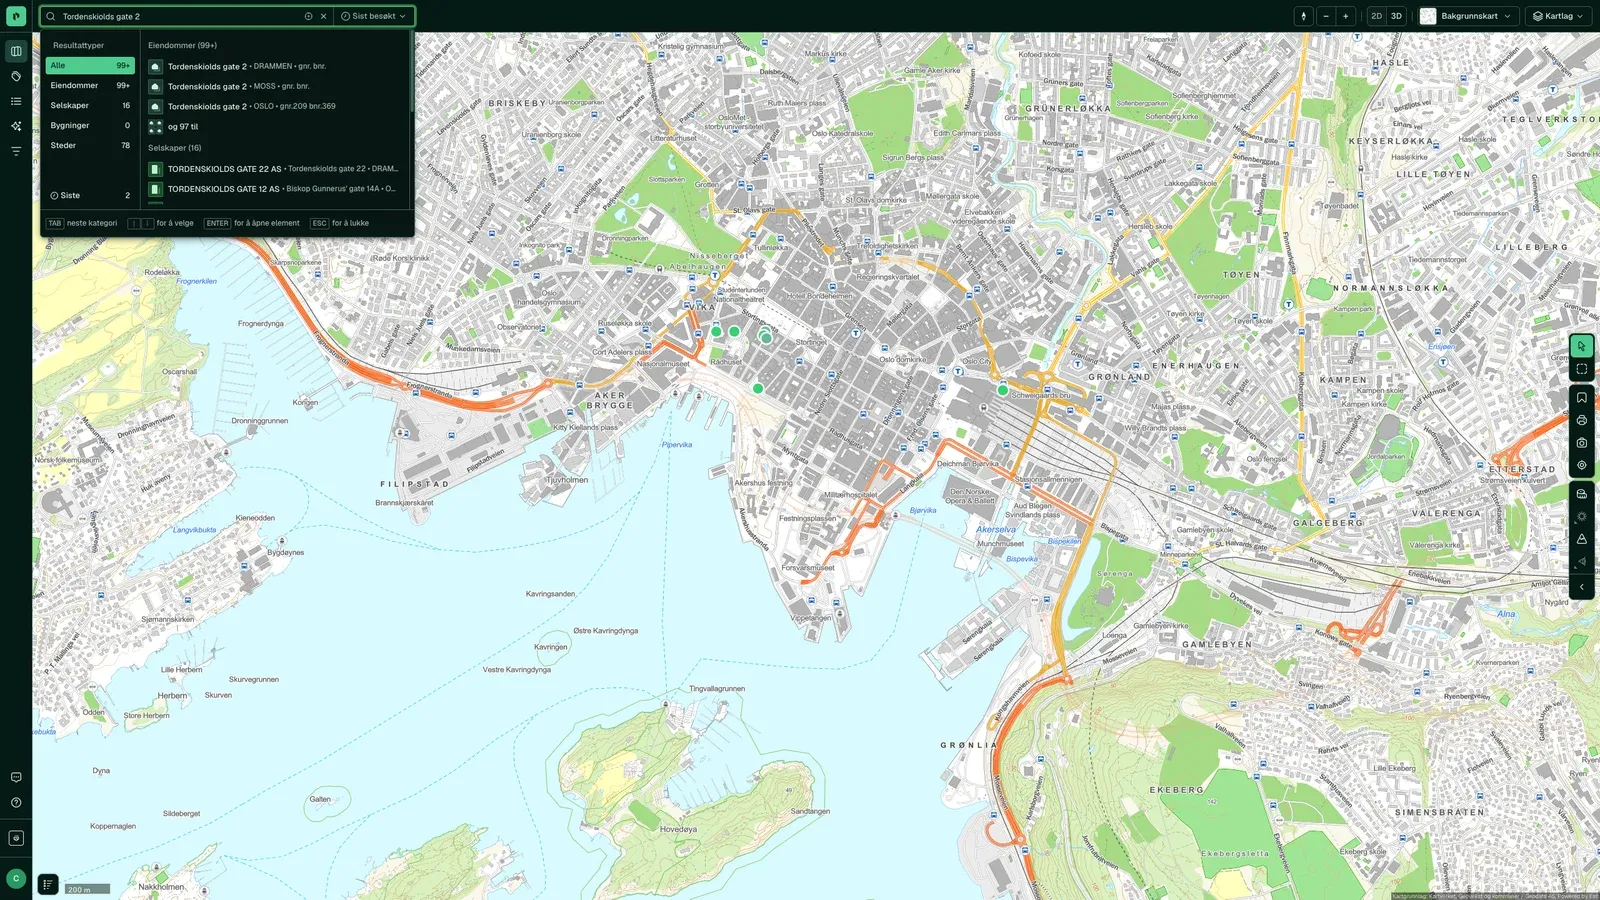
- registered ownership changes a year
- 240 000
- Source: docs.placepoint.no/om/tall, retrieved 16 October 2026
- links between companies and properties
- 5.3m
- Source: docs.placepoint.no/om/tall, retrieved 16 October 2026
- active companies, with what they own
- 1.1 million
- Source: docs.placepoint.no/om/tall, retrieved 16 October 2026
The sources behind the answers
Prices come from land registration, buyers from the company registers and building standards from energy labels. Every figure has a source.
Ask the Agent
The same answer in Claude, Copilot or ChatGPT
Placepoint AI gives your AI tool the same data as Fusion, with the source for each field. Three questions from this phase, and what you get back.
What office buildings have sold in Bjørvika in the last three years?
You getA table with price per m², date and buyer, plus a map.
Which companies own more than five commercial properties in Drammen?
You getA list of the owners and their portfolios, ready for buyer mapping.
Write an area memo for Storgata 12 with demographics and transport
You getA memo with figures, sources and map views you can paste into the prospectus.
Examples. About Placepoint AI
What customers say
How they use it in this phase
“Intuitive, clear, quick response.”
 Tom Espen Eide, Head of Commercial Property, Skanska
“Placepoint is our main platform for property information. In practice, we only use Placepoint now.”
 Petter Cedell, Executive Vice President, Property Investments, Selvaag Bolig
From scattered searches to a full market overview
The analysis team replaced a map system, external tools, Google and the Land Registry (Grunnboken) with one platform, and cancelled their previous data supplier.
Read the storyLearn more
Terms you will come across in this phase
What is yield?
Yield is a key measure of profitability in commercial property. We explain how to calculate it and what investors look for.
Read the articleTermsAbbreviations for home and plot area
Confused by BRA, BTA, BOA and P-ROM? Here is an overview of the most common area abbreviations.
Read the articleRegistersLand Registry
Grunnboken (the Land Registry) is Norway's register of property rights. Learn what it contains and how to read it.
Read the articleAcross the whole value chain