










Commercial agency and advisoryInterview, 31 August 2026
From scattered searches to a full market overview: how the analysts at Akershus Eiendom work
Akershus Eiendom is one of Norway's leading commercial property advisers. Its analysis team has to understand a market that is not transparent. Its facts used to be spread across a cumbersome map system, several external data services, Google and Grunnboken (the Norwegian land register). Today the work starts in Placepoint, with an evidence base that holds up when the advice has to support a transaction.
 Interview and text: Jakob Palmers, VP Growth & Revenue Operations
- Four sources became one platform
- 4 → 1
- departments on the platform: analysis, valuation and transactions
- 3
- customer since September 2024
- 2024

In brief
- The challenge
- The facts were spread across an outdated map system, several external services, Google and Grunnboken.
- The solution
- Ownership, tenants, transactions and area data in one platform, with Excel exports that feed into the team's own models.
- The result
- A better evidence base behind every piece of advice. Akershus Eiendom cancelled its contract with the previous data supplier in summer 2026 because Placepoint covered its needs.
About Akershus Eiendom
Since 1992, Akershus Eiendom has acted as adviser and broker on some of the largest transactions in the Norwegian market. The company covers the whole commercial property value chain: buying and selling properties and portfolios, letting (with separate departments for landlords and tenants), valuation and market analysis.
The analysis department has published market reportsOpens akershuseiendom.no in a new tab since 2001, the same year the company became the Norwegian partner of JLL, one of the world's largest commercial property firms. The quality of the advice depends directly on the quality of the facts behind it.
The market is not transparent
The analysis team keeps its own databases of transactions and leases, publishes market analyses, and supports the transaction and letting departments with investor prospectuses, pitches and sales presentations. Every piece of work needs precise answers: who owns the building, who occupies it, when was it sold, and what does the area actually look like.
The evidence base before PlacepointOutdated map system · External data services · Google · Grunnboken Anything the tools did not have was looked up manually.
The team's map system was outdated and hard to navigate, so hard that it often went unused. The team also had to rely on several external services alongside it, and looked up anything those services did not cover by hand in open sources.
"Before, we had to search Google and check Grunnboken. It took us much longer to find the information we needed, and the old map system was so cumbersome that we hardly used it."
 Synne Nappen, analyst at Akershus Eiendom
One place to start
Today, analysis work starts in Placepoint. The platform has replaced both the map system and the external lookup sources. The same searches come up every day: who owns the building, who occupies it, and when it was sold and handed over.
At area level, the team uses the platform to compare buildings with their neighbourhood. Each building is coloured by its energy label, so a single building can be read against the street around it rather than on its own.
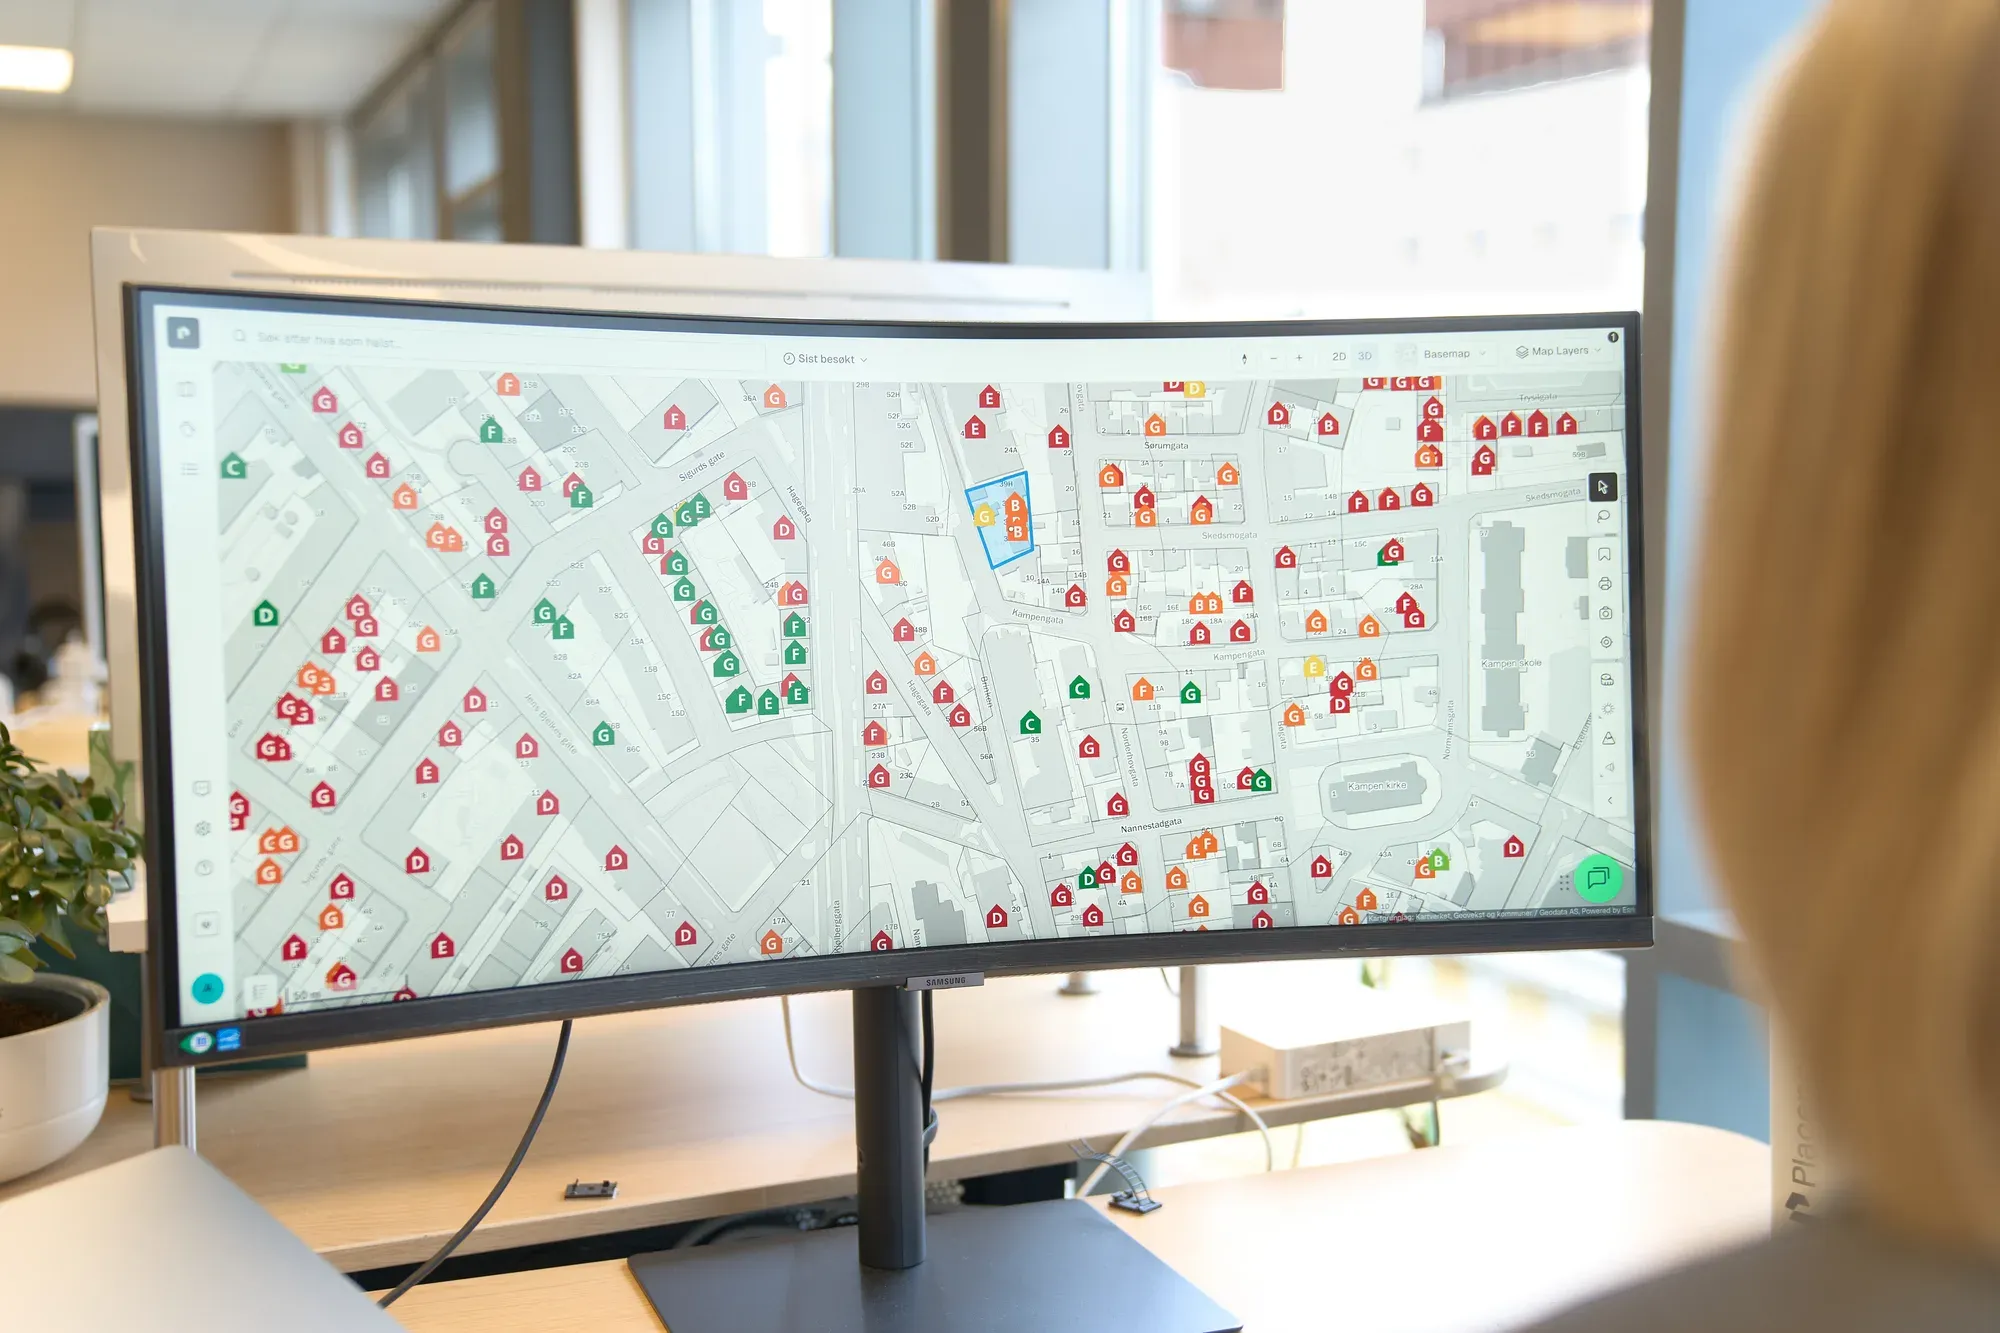
In a sales pitch for a building in Kvadraturen, the team pulled the energy labels for the whole area, saw that the neighbouring buildings generally scored worse, and used the building's better energy label as a selling point.
The Excel export connects the platform to the team's own analyses. Demographic data and other extracts come out as structured sheets, which the team filters by column and year and then works on in its own models, market reports and investor prospectuses. Map extracts with marked buildings and distances go straight into prospectuses and sales material.
"It's pretty nice that you get an Excel sheet out, so you can take it further yourself, choose what you need, and filter by columns and years."
Use is broad: analysis and valuation use the platform most, the transaction department uses it too, and the team uses almost every feature. The team finds that its suggestions get built into the product.
The evidence shapes the advice
The team's analyses end up in valuations, investor prospectuses and sales pitches, and they form the basis for buying and selling properties and portfolios. In that work, the facts are not a background detail. They are what the advice rests on, and a weak point in the evidence carries through to the client's decision.
So the most important change is not that searches are faster. It is that questions which used to go unanswered, because the tool was too cumbersome, now actually get looked into. Ownership, tenants, transaction history and area data come from quality-assured sources in one interface, not from four partial sources that have to be pieced together by hand.
The difference is accuracy. Advice built on incomplete evidence has to allow for what is missing. Advice built on evidence the team trusts can be specific.
You get an overview of the market. It feels as if you could be there in person.
The results
The clearest proof came in summer 2026: Akershus Eiendom cancelled its contract with its previous data supplier. Placepoint now covers the needs that supplier met, and the team found more there than they had with the previous service.
“Now you have more to base decisions on, because you actually have the information.”