








Datasets · Risk
Flood hazard map, already linked to every property.
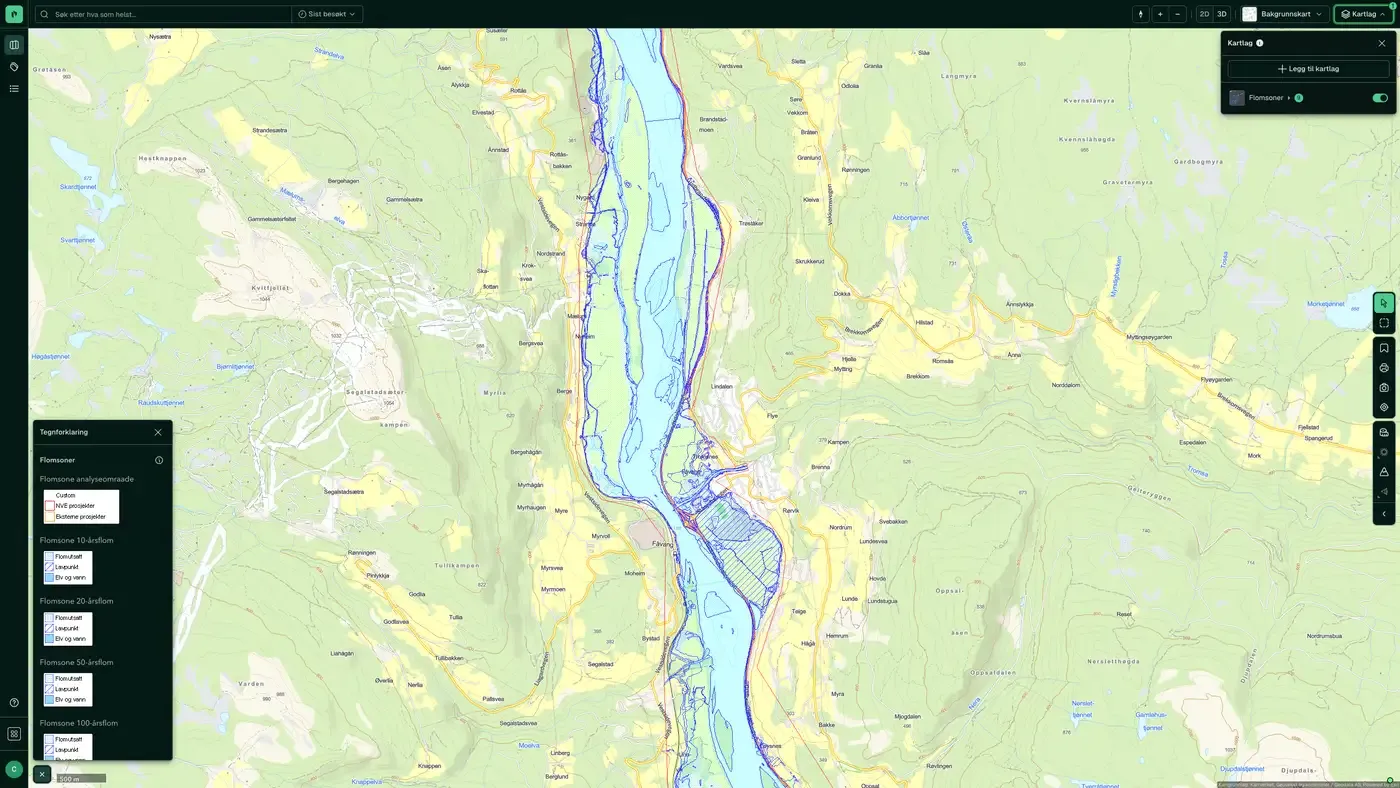
Flood zones show areas that are flooded at different flood magnitudes (return period). Flood zones are produced for the 20, 200 and 1,000 year floods.
What the dataset contains
Flood hazard map in Placepoint
Flood zones show areas that are flooded at different flood magnitudes (return period). Flood zones are produced for the 20, 200 and 1,000 year floods. In areas where climate change is expected to increase water flow by more than 20%, a flood zone is produced for the 200-year flood in the year 2100. Use: In land-use planning, you can use flood zones to identify areas that should not be developed, and to assess suitable risk-reducing measures if development cannot be avoided. Guidelines 2-2011 Flaum- og skredfare i arealplanar describe how to meet the safety requirements for buildings in the building regulations (TEK 17) § 7-2 in land-use planning. In detailed planning and when processing subdivision and building applications, you must allow for the limited accuracy of the flood zones: start from the calculated water levels and check the ground level on site. If you plan development in flood-prone areas, you should add a safety margin to the calculated water levels to allow for uncertainty in the data and calculations. Source: Norges vassdrags- og energidirektorat (NVE). Part of Placepoint's Risk map layer.
This text is based on the dataset documentation, synced 16 October 2026.
What it looks like
Flood hazard map on the map
The dataset is part of the Risk map layer. The screenshot, sublayers and what a click on the map shows are under Flood hazard map.
Update frequency: Real time. Last updated 9 September 2026
More in the Risk map layer
Datasets often read together
Caution surfaces, (regulated) water, dams
NVE's flood awareness map: a coarser first assessment of where flood hazard should be investigated further.
About the datasetFire Stations Response Time
Placepoint's derived analysis of all fire stations in Norway with their driving response time zones: 5, 10 and 20 minutes, calculated from each station.
About the datasetHigh tide / storm surge
Modelled storm surge and sea level rise zones for Norway's coast, supplied to Placepoint by Geodata AS.
About the datasetQuick clay
Quick clay is a particular type of marine clay that loses all its bearing capacity when disturbed or loaded. It is the single factor in Norwegian geotechnics that most often stops development projects or makes them more expensive.
About the datasetQuick Clay – Caution
Shows areas that may be exposed to quick clay landslides, based on marine clay deposits and terrain criteria (slope and height difference).
About the datasetRadon susceptibility
Areas in Norway that are likely to be more exposed to radon than others, based on the Norwegian Radiation Protection Authority's (NRPA) national database of indoor air measurements and NGU's bedrock and superficial deposit databases.
About the datasetHow often is the flood hazard map updated?
Real time. The update frequency follows the source and is shown on the dataset in Placepoint.
Where does the data come from?
From Norges vassdrags- og energidirektorat. We collect and quality-check the data, then link it to the right property, with source and date on every field.
How do I see the flood hazard map on a property?
Look up the address in Fusion and turn on the Risk map layer. The dataset is there as its own layer, and the details appear in the property panel when you click on the map.
Can I get the dataset programmatically?
Yes. The same data is available in Placepoint API and in Placepoint AI through MCP, so you can bring it into your own systems and agents.
Used where decisions really matter