








Datasets · Demographics
Daytime population, linked to every property.
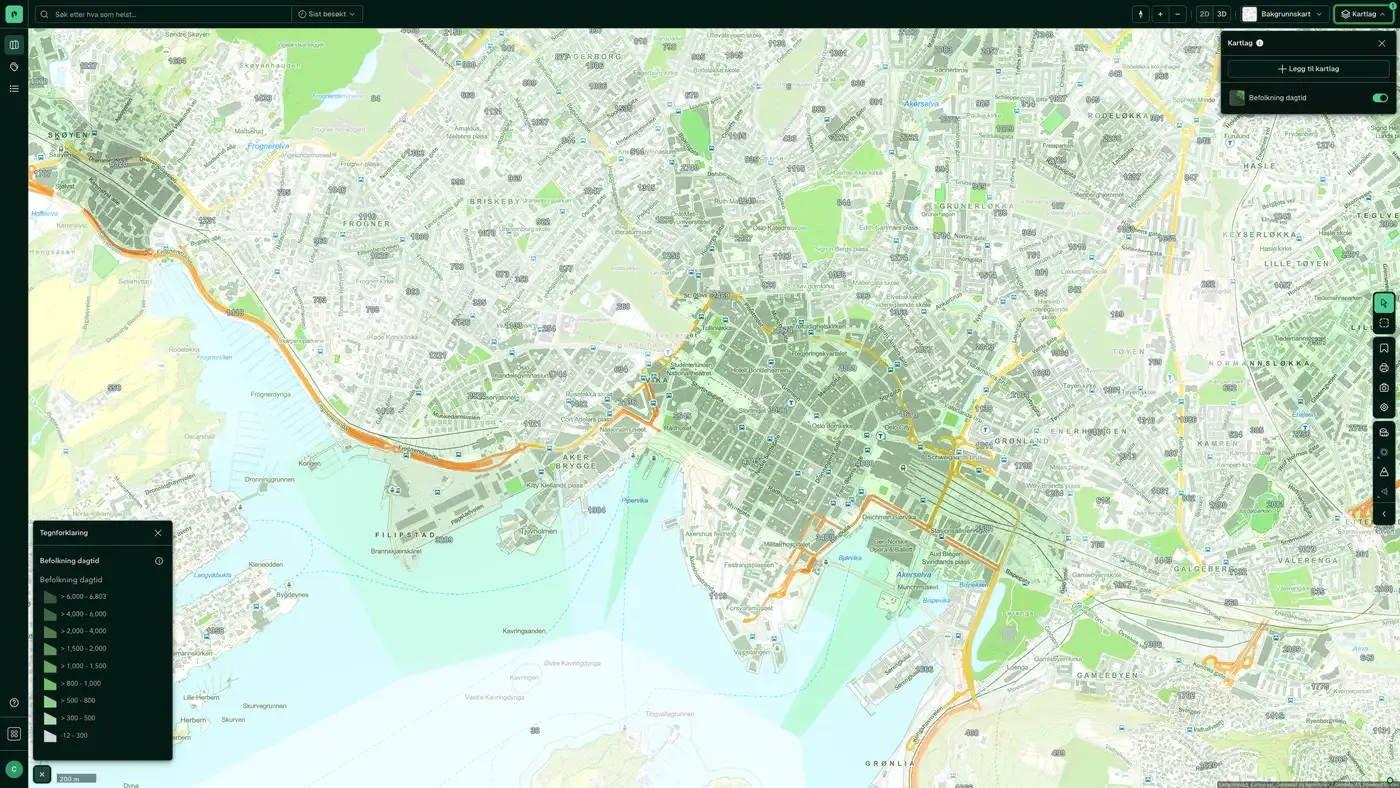
The number of people in each basic statistical unit during working hours, typically based on workplaces, schools and commuting. The dataset is modelled with commuter flows included. As a result, city centres often have a much higher daytime population than night-time population, and commuter towns the opposite.
What the dataset contains
Daytime population in Placepoint
The number of people in each basic statistical unit during working hours, typically based on workplaces, schools and commuting. The dataset is modelled with commuter flows included, so city centre areas often have a much higher daytime population than night-time population, and commuter suburbs the opposite. Supplied to Placepoint by Geodata AS, based on SSB's employment and commuting statistics.
For commercial property agents and retail analysts, daytime population is often more relevant than night-time population when assessing demand for retail, office buildings or restaurants in a particular location. For residential developers, the combination "low daytime population, high night-time population" can be a useful signal of a stable residential area. Read it together with Population, Age distribution, Households and Main Industry per Basic Statistical Unit to understand the local market structure. Part of Placepoint's map layers for Demographics and Business.
This text is based on the dataset documentation, synced 16 October 2026.
What it looks like
Daytime population on the map
The dataset is part of the Demographics map layer:
More in the Demographics map layer
Datasets often read together
Age distribution
Average age per basic statistical unit in Norway.
About the datasetPopulation
Population per basic statistical unit: the number of registered residents at the latest reference date.
About the datasetPopulation grid 100 m x 100 m
The map layer shows the number of residents in each cell of a 100 × 100 metre grid.
About the datasetWealth
Average net wealth per basic statistical unit, based on annual tax assessments from Skatteetaten (the Norwegian Tax Administration), compiled and published by Statistisk sentralbyrå (SSB) and distributed to Placepoint by Geodata AS.
About the datasetHouseholds
The number of households and their main composition per basic statistical unit, in five categories: single, no children; single, with children; multi-family; Couple, with children; and Couple, no children.
About the datasetIncome
Average gross income per basic statistical unit, based on annual tax assessments from Skatteetaten (the Norwegian Tax Administration), compiled by Statistisk sentralbyrå (SSB) and distributed to Placepoint by Geodata AS.
About the datasetHow often is daytime population updated?
Annually. The frequency follows the source and is shown on the dataset in Placepoint.
Where does the data come from?
From Geodata AS. We collect and quality-check the data and place it on the correct property, with source and date on every field.
How do I see daytime population for a property?
Look up the address in Fusion and turn on the Demographics map layer. The dataset is a separate layer there, and the details appear in the property panel when you click on the map.
Can I get the dataset programmatically?
Yes. The same data is available in Placepoint API and in Placepoint AI through MCP, so you can bring it into your own systems and agents.
Used where decisions really matter