








Map layers · 8 layers
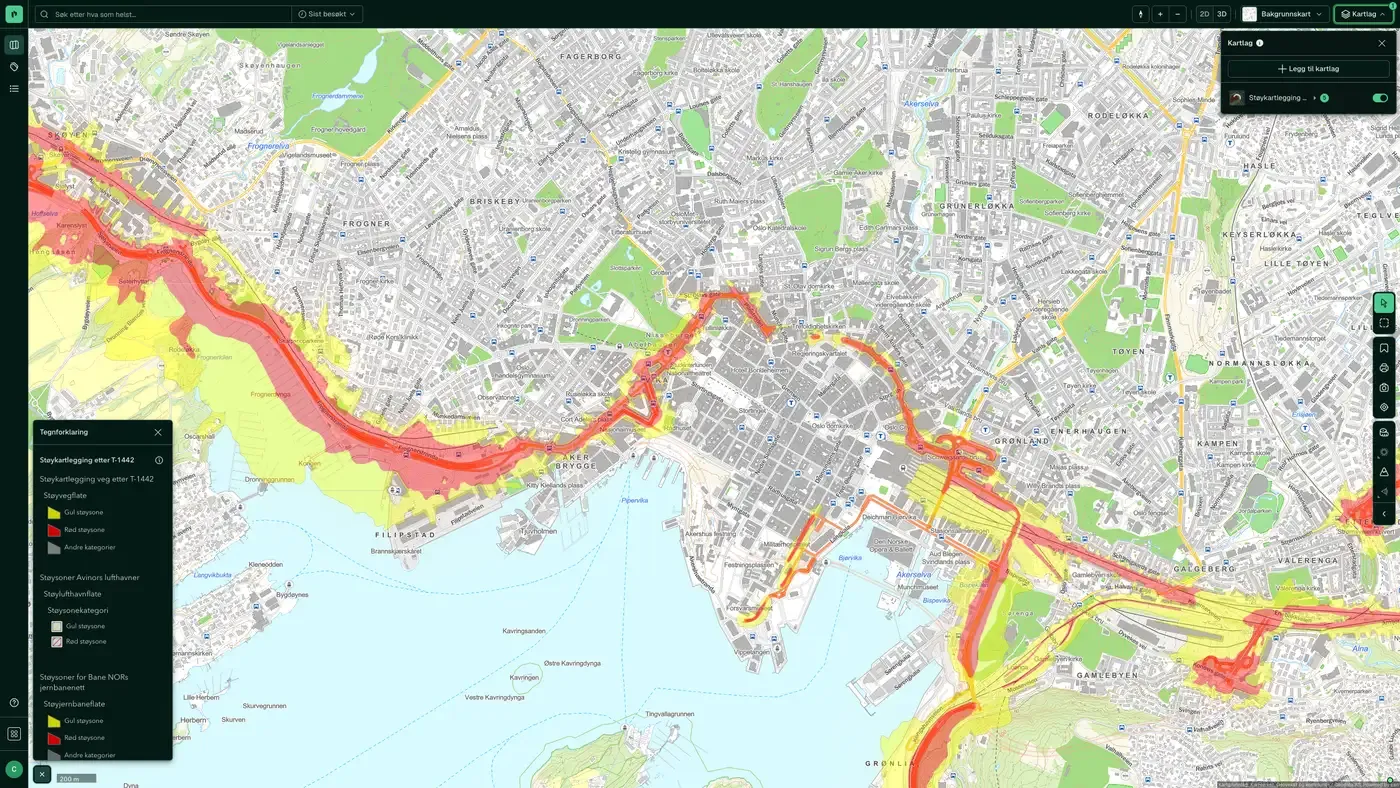
Noise, layer by layer over the property.
The Noise category shows calculated noise levels from road traffic and railways, as well as the T-1442 warning zones used in land use planning. The layers are useful when you assess homes and office premises along busy roads, and to find out whether a Plan Area is affected by a yellow or red noise zone.
The layers
8 layers in Noise
| Layer | Description | Source |
|---|---|---|
| Rail/metro/tram noise | Calculated average 24-hour noise from railways and light rail at a height of 4 m | Miljødirektoratet |
| Noise mapping (T-1442) | Noise warning map with yellow and red zones under the national guideline | Miljødirektoratet |
| Noise Map – Rail | Average 24-hour noise from railways at 4 metres above ground, modelled (not measured) | Miljødirektoratet |
| Noise Map – Rail (Night) | Average night-time noise from railways at 4 metres above ground, modelled (not measured) | Miljødirektoratet |
| Noise Map – Rail – Metropolitan | Average 24-hour noise from railways at 4 metres above ground, modelled (not measured), for the metropolitan areas of Oslo, Bergen, Trondheim, Stavanger, Sarpsborg and Fredrikstad | Miljødirektoratet |
| Noise Map – Rail – Metropolitan (Night) | Average night-time noise from railways at 4 metres above ground, modelled (not measured), for Oslo, Bergen, Trondheim, Stavanger, Sarpsborg and Fredrikstad | Miljødirektoratet |
| Noise Map – Road – Metropolitan | Average 24-hour noise from road traffic at 4 metres above ground, modelled (not measured), for the large cities of Oslo, Bergen, Trondheim, Stavanger, Sarpsborg and Fredrikstad | Miljødirektoratet |
| Noise Map – Road – Metropolitan (Night) | Average night-time noise from road traffic at 4 metres above ground, modelled (not measured), for Oslo, Bergen, Trondheim, Stavanger, Sarpsborg and Fredrikstad | Miljødirektoratet |
Layer by layer
What each layer shows
Rail/metro/tram noise
The same calculation for railways, metro and trams. Noise from rail traffic has different characteristics from road noise (more impulsive, with greater variation between day and night), so we show it in a separate layer. Source: Bane NOR and local public transport companies. Average Lden noise from railways at a height of 4 metres. Modelled data, showing lines with at least 30,000 trains per year outside the cities (the situation around 2016).
Noise mapping (T-1442)
T-1442 is the Norwegian Environment Agency's (Miljødirektoratet) guideline for handling noise in land use planning. The layer shows the official warning zones: Yellow zone (Lden 55-65 dB): noise-sensitive buildings should not normally be built without noise mitigation.
Noise Map – Rail
Average 24-hour noise from railways at 4 metres above ground, modelled (not measured). The maps show the situation in 2016. Average 24-hour noise from railways at 4 metres above ground, modelled (not measured). The maps show the situation in 2016. Not for use in land use planning.
Noise Map – Rail (Night)
Average night-time noise from railways at 4 metres above ground, modelled (not measured). The maps show the situation in 2016. Average night-time noise from railways at 4 metres above ground, modelled (not measured). The maps show the situation in 2016. Not for use in land use planning.
Noise Map – Rail – Metropolitan
Average 24-hour noise from railways at 4 metres above ground, modelled (not measured), for the metropolitan areas of Oslo, Bergen, Trondheim, Stavanger, Sarpsborg and Fredrikstad. The maps show the noise situation as it was in 2016. Average 24-hour noise from railways at 4 metres above ground, modelled (not measured), for the metropolitan areas of Oslo, Bergen, Trondheim, Stavanger, Sarpsborg and Fredrikstad. The maps show the noise situation as it was in 2016. The noise map cannot be used for land use planning.
Noise Map – Rail – Metropolitan (Night)
Average night-time noise from railways at 4 metres above ground, modelled (not measured), for Oslo, Bergen, Trondheim, Stavanger, Sarpsborg and Fredrikstad. The maps show the noise situation as it was in 2016. Average night-time noise from railways at 4 metres above ground, modelled (not measured), for Oslo, Bergen, Trondheim, Stavanger, Sarpsborg and Fredrikstad. The maps show the noise situation as it was in 2016. The noise map cannot be used for land use planning.
Noise Map – Road – Metropolitan
Average 24-hour noise from road traffic at 4 metres above ground, modelled (not measured), for the large cities of Oslo, Bergen, Trondheim, Stavanger, Sarpsborg and Fredrikstad. The maps show the noise situation as it was in 2016. Average 24-hour noise from road traffic at 4 metres above ground, modelled (not measured), for the large cities of Oslo, Bergen, Trondheim, Stavanger, Sarpsborg and Fredrikstad. The maps show the noise situation as it was in 2016. The noise map cannot be used for land use planning.
Noise Map – Road – Metropolitan (Night)
Average night-time noise from road traffic at 4 metres above ground, modelled (not measured), for Oslo, Bergen, Trondheim, Stavanger, Sarpsborg and Fredrikstad. The maps show the noise situation as it was in 2016. Average night-time noise from road traffic at 4 metres above ground, modelled (not measured), for Oslo, Bergen, Trondheim, Stavanger, Sarpsborg and Fredrikstad. The maps show the noise situation as it was in 2016. The noise map cannot be used for land use planning.
The datasets behind
Datasets in Noise
Noise Map – Rail
Average 24-hour noise from railways at 4 metres above ground, modelled (not measured).
About the datasetNoise Map – Rail (Night)
Average night-time noise from railways at 4 metres above ground, modelled (not measured).
About the datasetNoise Map – Rail – Metropolitan
Average 24-hour noise from railways at 4 metres above ground, modelled (not measured), for the metropolitan areas of Oslo, Bergen, Trondheim, Stavanger, Sarpsborg and Fredrikstad.
About the datasetNoise Map – Rail – Metropolitan (Night)
Average night-time noise from railways at 4 metres above ground, modelled (not measured), for Oslo, Bergen, Trondheim, Stavanger, Sarpsborg and Fredrikstad.
About the datasetNoise Map – Road – Metropolitan
Average 24-hour noise from road traffic at 4 metres above ground, modelled (not measured), for the major cities of Oslo, Bergen, Trondheim, Stavanger, Sarpsborg and Fredrikstad.
About the datasetNoise Map – Road – Metropolitan (Night)
Average night-time noise from road traffic at 4 metres above ground, modelled (not measured), for Oslo, Bergen, Trondheim, Stavanger, Sarpsborg and Fredrikstad.
About the datasetHow do I turn on the noise layers in Fusion?
Click Map layers at the top right of the map, select the category in the list on the left and turn on the layer. You can have several layers on at once, over the same property.
Where do the layers come from?
The sources are listed in the table above, including Miljødirektoratet. Each layer shows its source and date.
Can I get the same data programmatically?
Yes. The datasets behind the layers are available in the Placepoint API and in Placepoint AI through MCP.
Other categories
The layers and descriptions come from the documentation, synced 16 October 2026.
Used where decisions really matter