








Datasets · Infrastructure
Fibre coverage, already linked to every property.
Share of households offered 1 Gbit/s fibre, from Nkom's annual coverage survey. The dataset is available by county, municipality, 1,000 m and 250 m grid, and as household points, so you can answer the same question for a single plot and for a whole market.
What the dataset contains
Fibre coverage in Placepoint
Share of households offered 1 Gbit/s fibre, from Nkom's annual coverage survey. The dataset is available by county, municipality, 1,000 m and 250 m grid, and as household points, so you can answer the same question for a single plot and for a whole market.
The dataset shows where fibre is offered, not who provides it. Nkom collects figures per provider but publishes coverage aggregated across providers. No open Norwegian source names the provider at an address: physical cable routes can be exempt under the geodata regulations and the Security Act, and Ledningsportalen shares routes only through the excavation notice process. To find out who can actually supply a specific address, you still need to ask the providers.
For a developer, fibre is a basic requirement in two segments: offices and data centres, where capacity decides whether the building is an option at all, and housing outside cities, where fibre is a selling point and a lack of fibre genuinely lowers value. The grid lets you see that the neighbourhood has fibre even if this particular plot is not registered with an offer. Part of Placepoint's Infrastructure map layers. Related: Broadband coverage, which shows speed classes per building from the same survey.
The figure is an offer as reported by the providers, not a confirmed connection. A building can be listed with an offer and still need its own connection work.
Source: Nkom, coverage survey 2023.
This text is based on the dataset documentation, synced 16 October 2026.
What it looks like
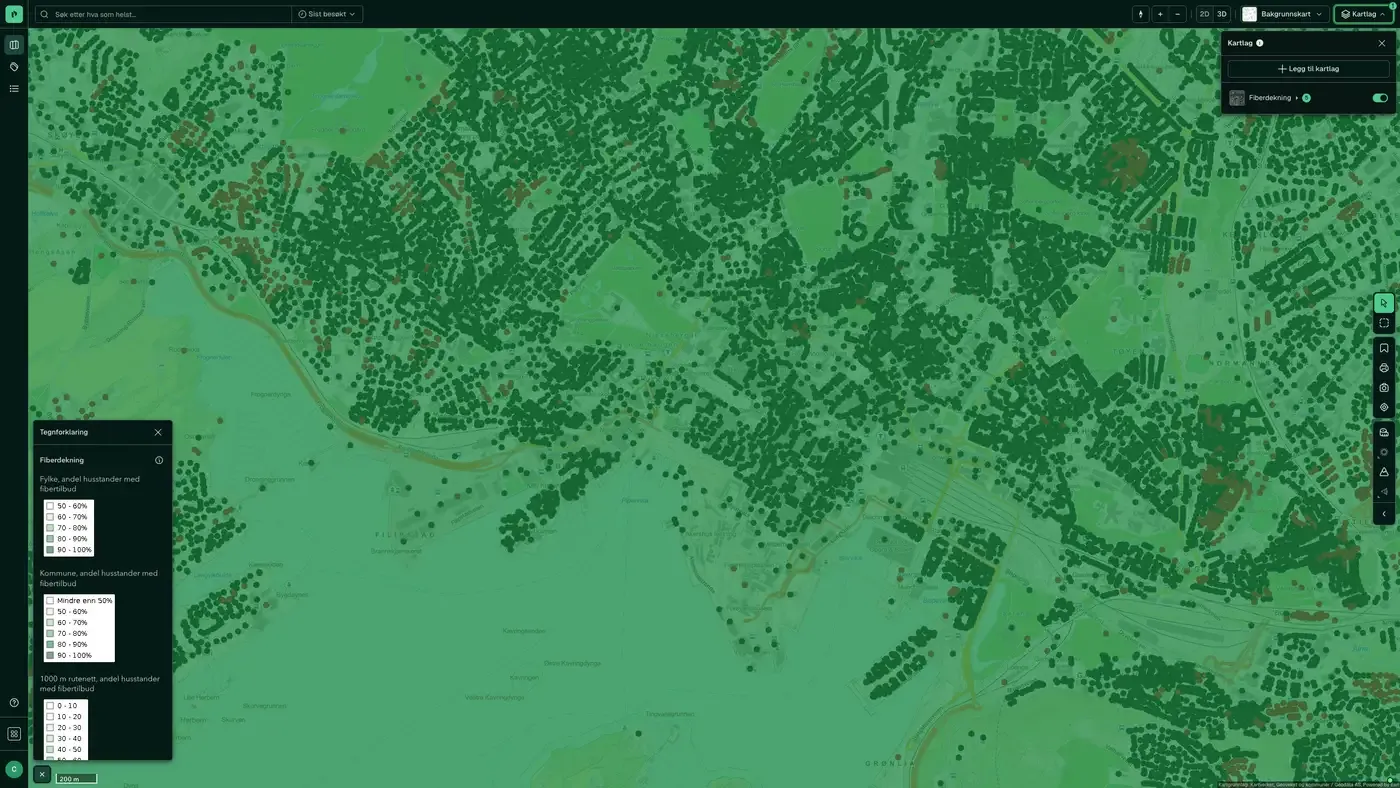
Fibre coverage on the map
The dataset is part of the Infrastructure map layer. You can turn five views on and off separately, from coarse to fine:
View | Use
County | Compare regions
Municipality | Market selection and portfolio review
1,000 m grid | Area level
250 m grid | Plot level, on by default
Households | Individual points with fibre available
The colour shows the share of households in the cell with fibre available: darker green means a higher share.
Click a cell or a point to see the share of households with fibre available, and the municipality number in the municipality and county views. Last updated 9 September 2026
More in the Infrastructure map layer
Datasets often read together
Fuel stations
All fuel stations in Norway with chain affiliation (Circle K, Shell, Esso, YX, Best, Uno-X and others), number of employees and accounts data.
About the datasetBroadband coverage
Broadband coverage per building, grouped into speed classes.
About the datasetBridges
All bridges and bridge-like structures in Norway, taken from the Norwegian Public Roads Administration's National Road Database (NVDB): planned, newly built, demolished, in use, not in use and closed or blocked.
About the datasetMunicipality Borders
Norway's 357 municipalities with municipality number (four-digit code) and official outer boundaries.
About the datasetManhole cover, drain and hydrant
Visible points on the municipal water and sewage network: manholes, gullies and fire hydrants, taken from LedningVA in Felles kartdatabase (FKB).
About the datasetPost offices and postal locations
Locations of post offices and post-in-shop outlets in Norway.
About the datasetHow often is fibre coverage updated?
Annually. The frequency follows the source and is shown on the dataset in Placepoint.
Where does the data come from?
From public and licensed sources. The source is shown on every field in Placepoint.
How do I see fibre coverage on a property?
Look up the address in Fusion and turn on the Infrastructure map layer. The dataset is there as its own layer, and the details appear in the property panel when you click on the map.
Can I get the dataset programmatically?
Yes. The same data is available in Placepoint API and in Placepoint AI through MCP, so you can bring it into your own systems and agents.
Used where decisions really matter