








Datasets
Zoning plan legend, already linked to every property.
The colours on the zoning plan map follow the SOSI standard for area purposes. This page shows the main categories and what they usually mean in practice.
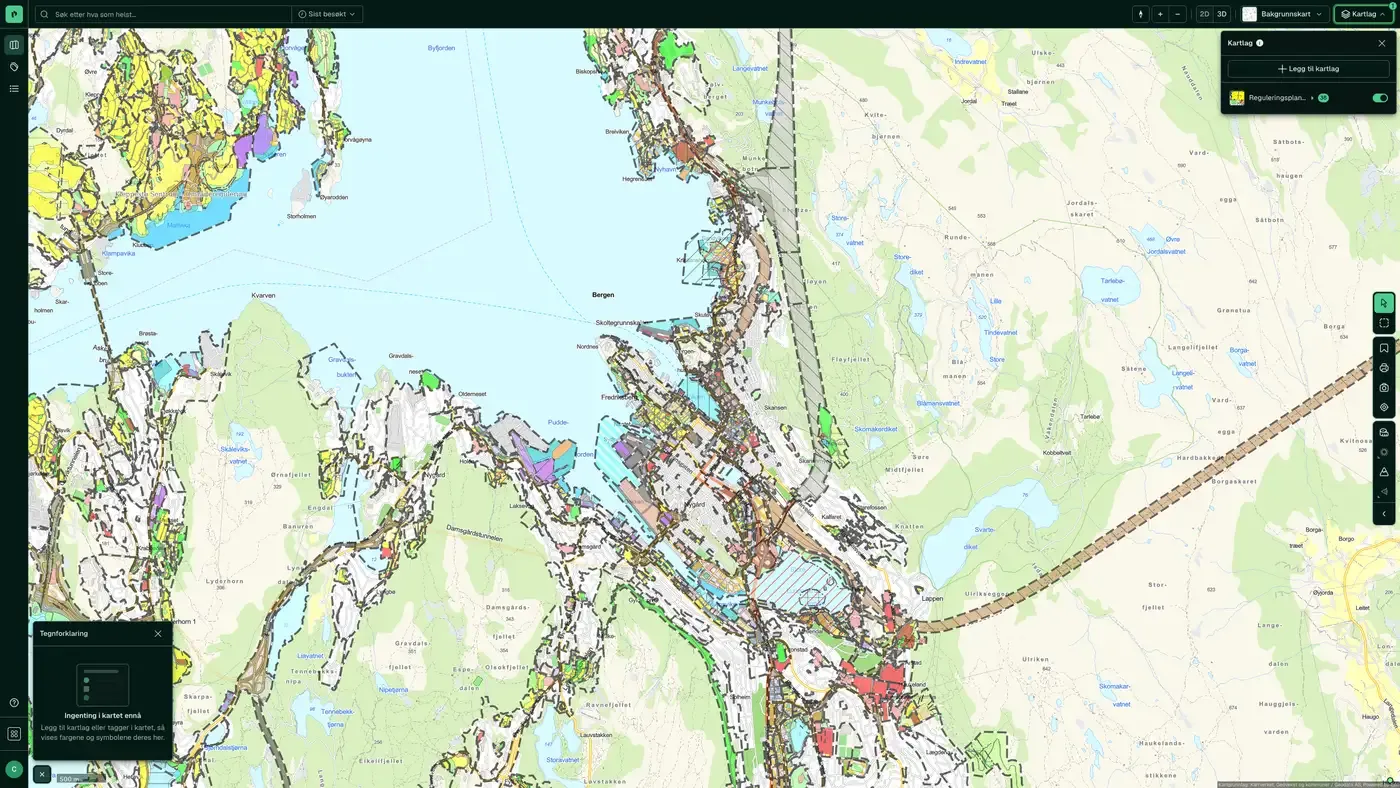
What the dataset contains
Zoning plan legend in Placepoint
The colours on the zoning plan map follow the SOSI standard for area purposes. This page shows the main categories and what they usually mean in practice.
This text is based on the dataset documentation, synced 16 October 2026.
How often is the zoning plan legend updated?
The update frequency follows the source and is shown on the dataset in Placepoint.
Where does the data come from?
From public and licensed sources. The source is shown on every field in Placepoint.
How do I see the zoning plan legend on a property?
Look up the address in Fusion. The dataset is in the property panel for the property.
Can I get the dataset programmatically?
Yes. The same data is available in Placepoint API and in Placepoint AI through MCP, so you can bring it into your own systems and agents.
Used where decisions really matter